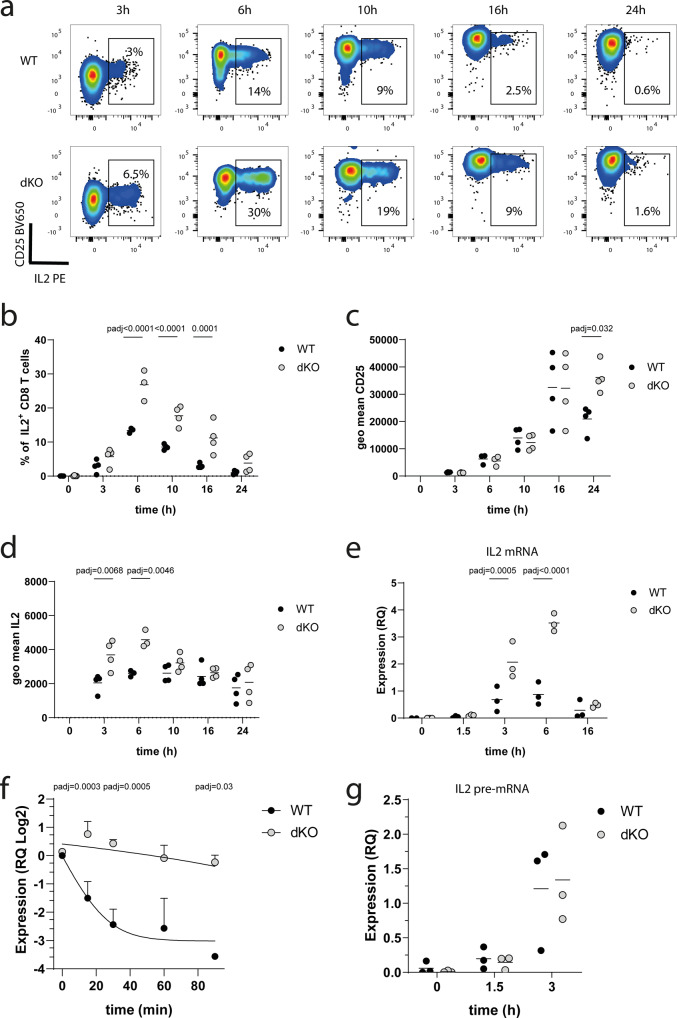
Fig. 5. ZFP36 and ZFP36L1 suppress IL-2 production.
a Representative flow cytometry plots showing IL-2 and CD25 staining intensity by naive OT-I cells stimulated with N4 peptide for the indicated times. b A plot showing frequency of IL-2 producing OT-I cells over time; (c) Geometric mean of CD25 fluorescence per cell over time. d Geometric mean of IL-2 fluorescence per cell over time. Graphs in (a–d), are compiled from three independent experiments. Each point represents a biological replicate. e Relative quantity of IL2 mRNA expression measured by real time PCR, in naive WT and dKO OT-I cells which were stimulated for the indicated times with N4 peptide. Relative quantities of IL2 mRNA to RPL32 mRNA are shown. f Relative quantity of IL2 mRNA expression, measured by real time PCR, in naive WT and dKO OT-I cells stimulated for 3 h with N4 peptide and treated with Triptolide for indicated times. A linear regression model of one phase decay was fitted on the data. Data is presented as mean values ± SD from n = 3 biological replicates. Statistical significance was determined on non-transformed data. g Relative quantity of unprocessed IL2 pre-mRNA expression in naive WT and dKO OT-I cells stimulated with N4 peptide for indicated times. IL2 pre-mRNA expression was normalized to RPL32 mRNA expression. Each point represents a biological replicate. Statistical significance in (b–g) was determined using a mixed-effects model analysis followed by Sidak’s post-test for multiple comparisons. In all panels filled circles represent the respective WT control and open shaded circles dKO. Source Data are provided as Source Data file.

