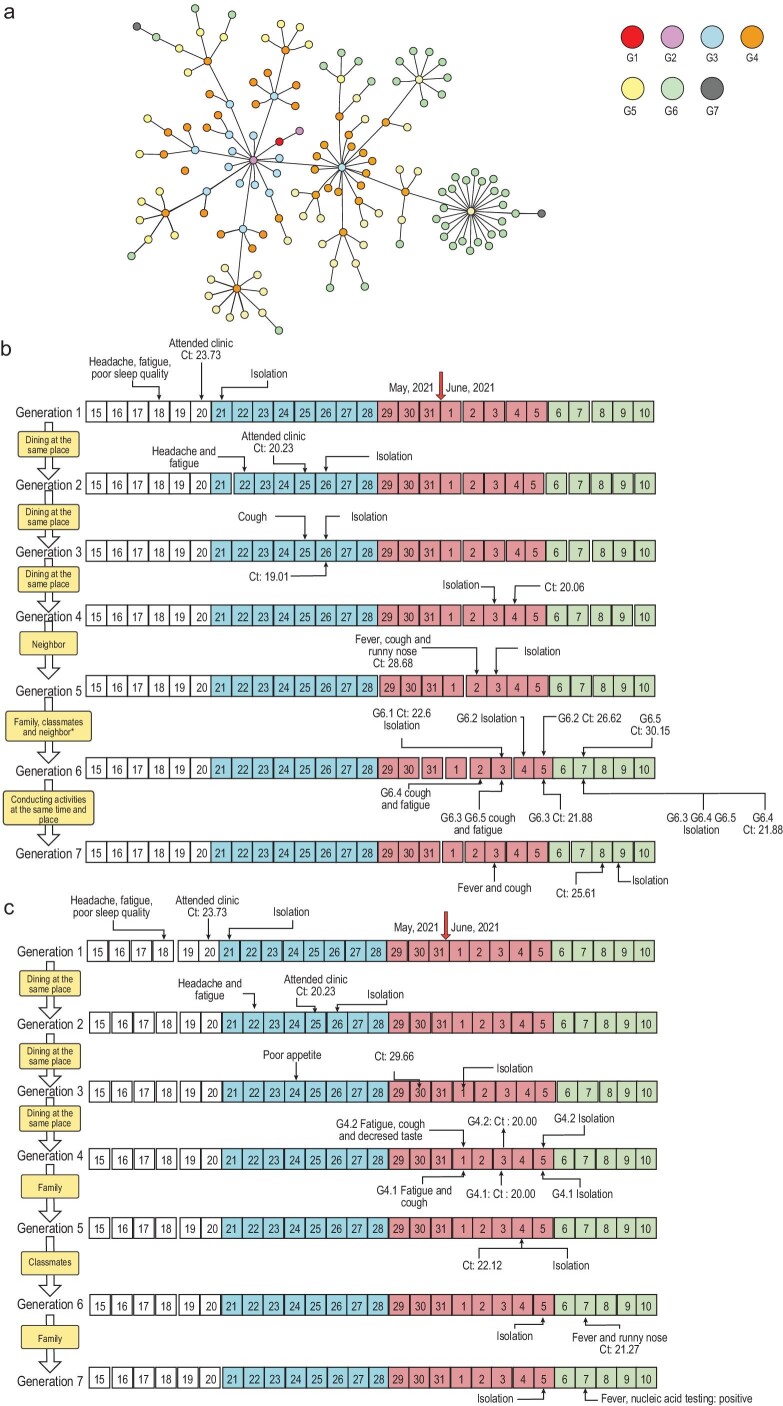
Figure 1.
Epidemiological linking network and two transmission chains confirmed by epidemiology investigation and whole-genome sequencing. (a) One hundred and forty-three cases are shown in the network. Cases in each generation are shown in circles with different colors. The first-generation patient (red circle, G1) is in the middle of the network. (b) Transmission Chain I. There are five cases in the sixth generation. G6.1 was a family member of G5, G6.2 was one of the classmates of G6.1. G6.3, G6.2 and G6.1 were the neighbors of G6.4. (c) Transmission Chain II. Highlighted in white represents the time before this epidemic onset; blue, red and green represent the second, third and fourth stages of the epidemic, respectively; the yellow boxes indicate the epidemiological relationships between generations. G, generation of transmission.

