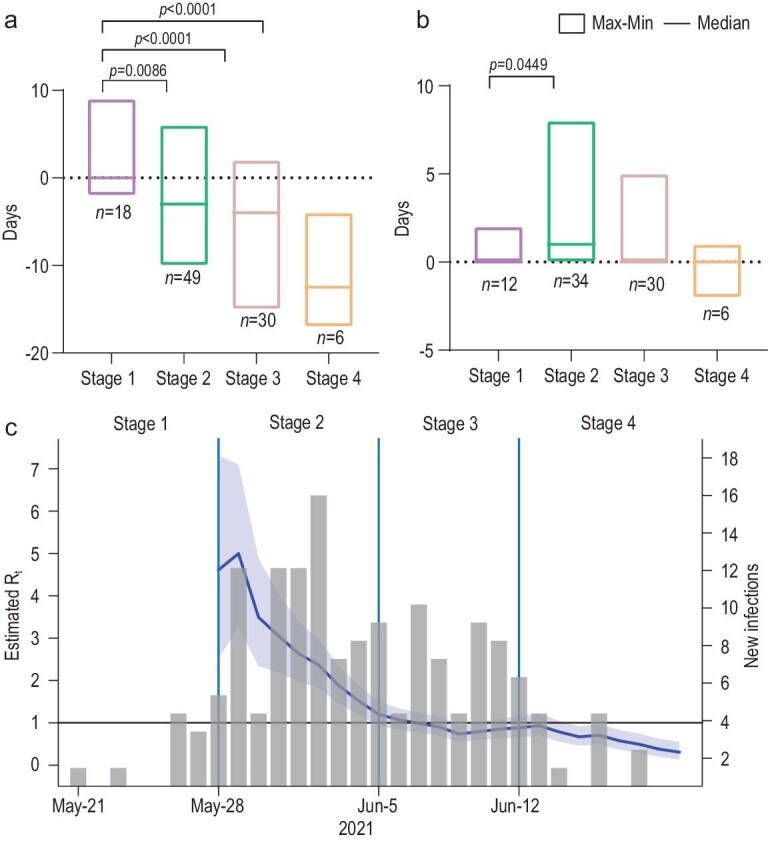
Figure 4.

Effectiveness of epidemic control. (a) Interval between symptom onset and isolation among close contacts. (b) Interval between close-contacts identification and isolation. (c) Rt throughout the epidemic. Gray columns represent daily reported cases. The blue line represents the dynamic change of Rt and the surrounding purple area refers to 95% CI of Rt. The light-blue vertical lines separate the epidemic course into four stages.
