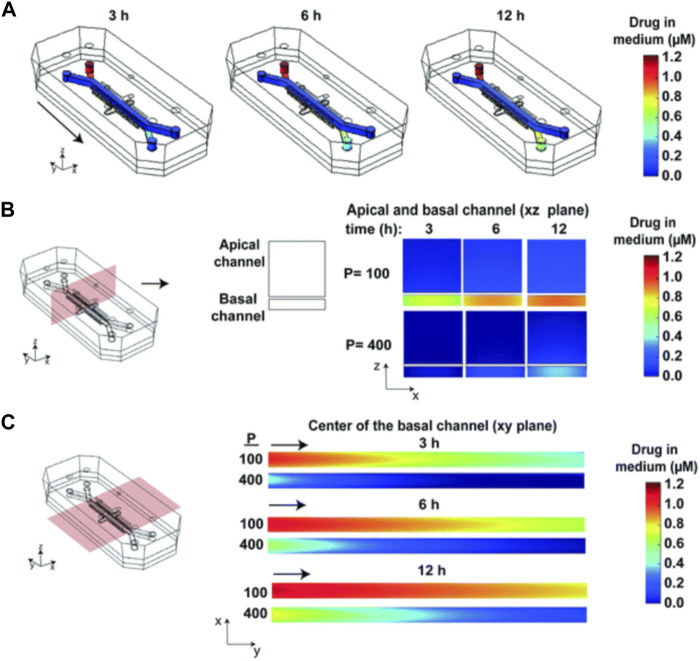
FIGURE 10.
Heat maps of the drug concentration. (A) 3D surface heat maps of the concentration of drug in the fluidic channels of the human lung airway chip at 3, 6, and 12 h; (B) 2D heat maps of drug concentration through a vertical cross section in the center of the chip; (C) 2D heat maps of drug concentration through a horizontal cross section in the center of the basal channel (Grant et al., 2021).

