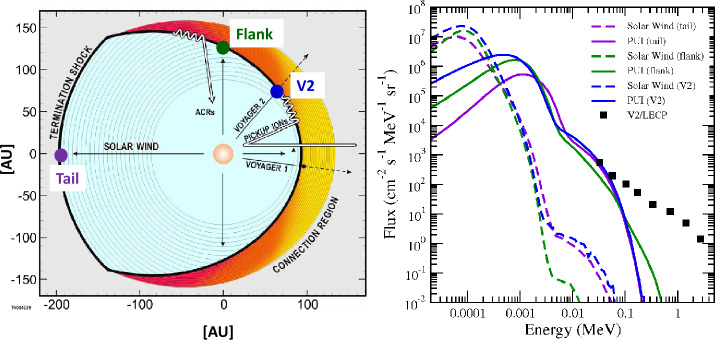
Fig. 2.
(Left panel) Representation of the blunt-shaped termination shock, interplanetary magnetic field lines, and ACR intensity, adapted from McComas and Schwadron (2006) to include three locations along the termination shock. (Right panel) energy spectra of pickup ions (solid curves) and solar wind (dashed curves) at the three locations shown in the left panel, with the same color representation. This figure is taken from Giacalone et al. (2021). The black squares in the right figure are Voyager 2 LECP observations taken just after the crossing of the termination shock (see also Giacalone and Decker 2010, for more details)

