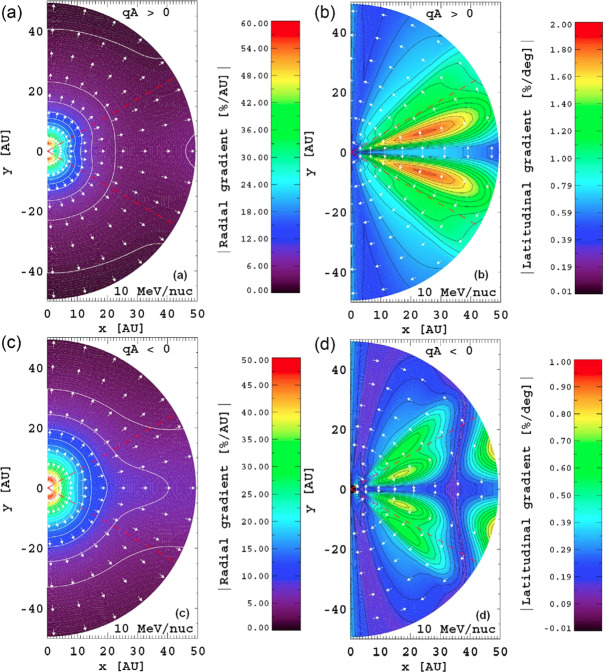
Fig. 3.
Simulated global spatial gradients for 10 MeV/nuc anomalous Oxygen shown in the meridional plane in the inner heliosphere for the two HMF ‘polarity’ cycles; panels (a, b) for and panels (c, d) for . Colour scale indicates the value of the radial gradient in panels (a, b) and the value of the latitudinal gradient in panels (c, d), whereas the arrows indicate the direction of increasing intensity. Dashed red lines in each panel indicate the latitudinal extent of the heliospheric current sheet. (Fig. 10 from Strauss and Potgieter 2010)

