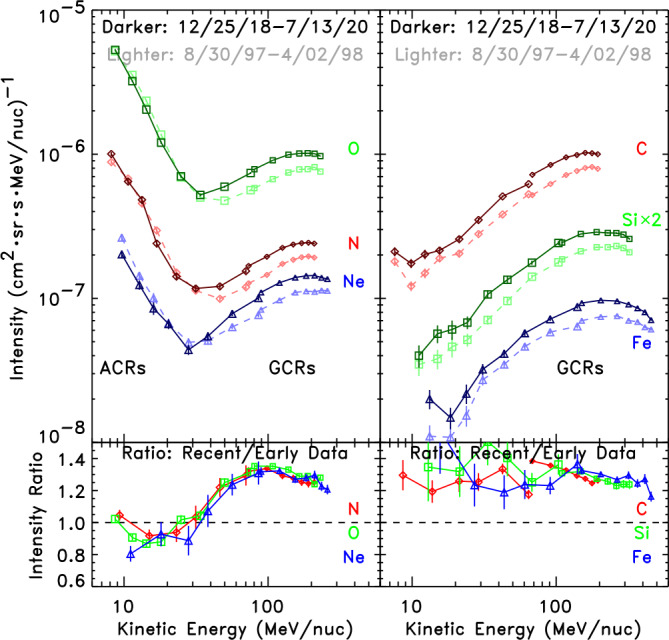
Fig. 7.

Energy spectra from the SIS (at lower energies) and CRIS (at higher energies) instruments on ACE for elements N, O, and Ne with strong ACR components (left panels) and C, Si, and Fe that are essentially pure GCRs at 1 AU (right panels). For each element, spectra are shown in two periods, one near the 1997 solar minimum (lighter dashed curves) and one at the 2018–2020 solar minimum (darker solid curves), with ratios of the spectra at the two time periods shown in the bottom panels. All GCRs are seen to be significantly enhanced by a similar amount in the latest solar minimum relative to the earlier minimum throughout this energy range, while ACRs are somewhat depleted. For a similar comparison of spectra in the 2009 minimum with those in the 1997 period, see Leske et al. (2013)
