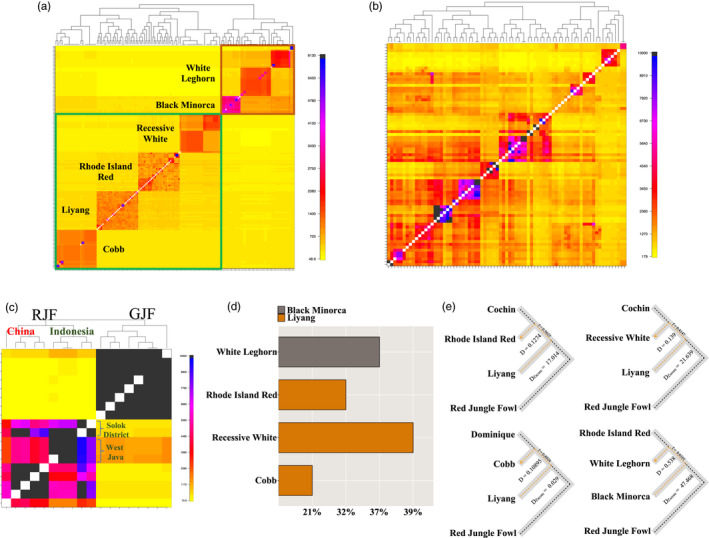
FIGURE 5.

Coancestries between chicken populations revealed by haplotype sharing. Visualizations of coancestry matrixes from a Finestructure clustering analysis illustrate the population structure and traces of recent population admixture events in the genomes of related chicken populations. The color in the heat map corresponds to the number of genomic motifs copied from a donor genome (row) to a recipient genome (column). The meat‐type (green box) and egg‐type (brown box) group of breeds (a), the breeds from Tibet and Sichuan (b), and the Junglefowls (c) were plotted. The top ancestry component was plotted for the commercial breeds (d), and graphical representation of clade arrangements for tests of introgression using Patterson's D statistic is provided (e)
