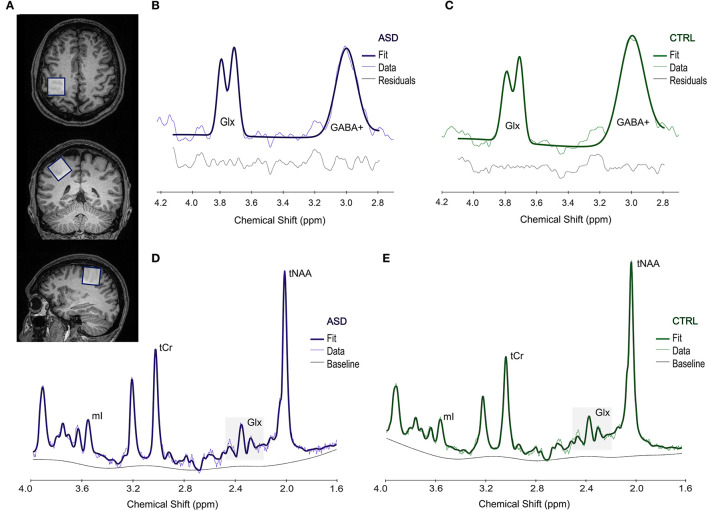
Figure 1.
Example of the voxel placement in the motor area (A). Upper panel shows a representative spectrum from an ASD (B) and a CTRL (C) participant, obtained from Gannet and used to estimate GABA+ levels. Lower panel shows a representative spectrum processed in LCModel, used to measure Glx levels in both ASD (D) and CTRL (E) groups. ASD, Autism Spectrum Disorder group; CTRL, control group; Glx, glutamate+glutamine; GABA+, gamma-aminobutyric acid; mI, myo-inositol; tCr, total creatine; tNAA, total N-acetylaspartate; ppm, parts per million.

