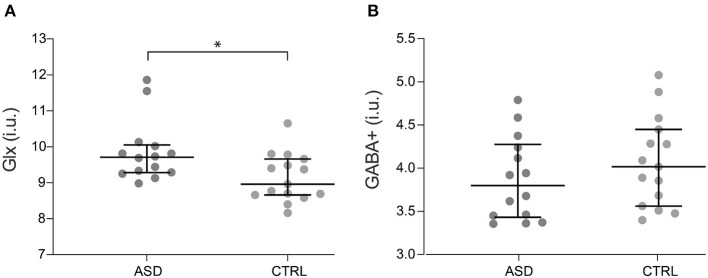
Figure 2.
Glx (A) and GABA+ (B) levels for ASD (n = 14) and control participants (n = 15). Dots represent individual values and horizontal lines depict median and 95% confidence interval. *p < 0.05. ASD, Autism Spectrum Disorder group; CTRL, control group; GABA+, gamma-aminobutyric acid; Glx, glutamate+glutamine.

