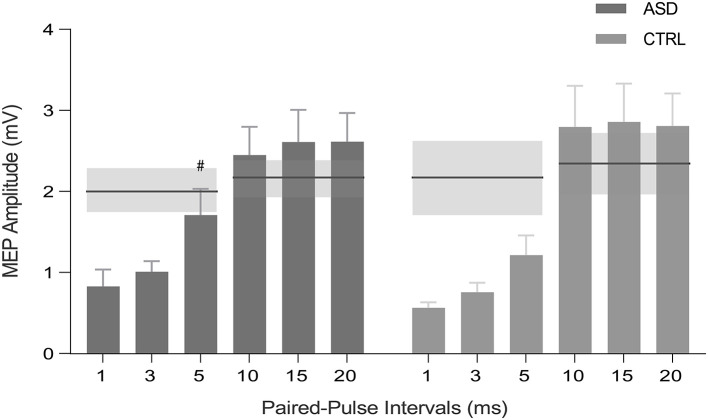
Figure 3.
MEP peak-to-peak amplitude for SICI (1, 3, and 5 ms) and ICF (10, 15, and 20 ms) intervals for ASD and control participants (CTRL). Horizontal lines represent the baseline condition (with no inhibitory or facilitatory effects), obtained by single-pulse TMS for each group and protocol. Inhibition occurs for bars below the horizontal lines, whereas excitation stands above the lines. SE of the means are illustrated in shaded horizontal bands and error bars. #p > 0.05 ASD, Autism Spectrum Disorder group; CTRL, control group; MEP, motor-evoked potential; SICI, short-interval intracortical inhibition; ICF, intracortical facilitation; S.E.; standard error of the mean.

