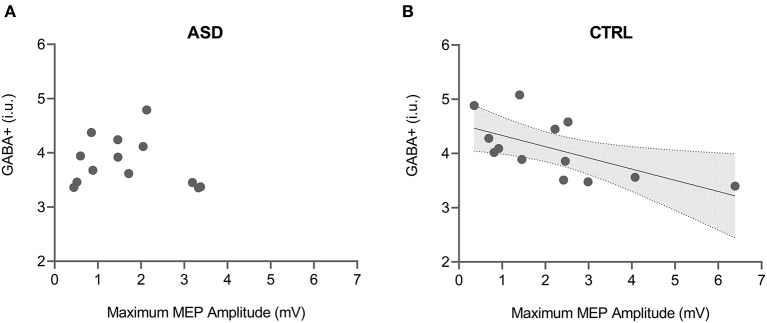
Figure 4.
Correlation between GABA+ levels and maximum MEP amplitude from input-output TMS protocol for both ASD (A) and control (B) groups. Shaded area in the scatter plot represents 95% CI for the significant correlation. ASD, Autism Spectrum Disorder group; CTRL, control group; GABA+, gamma-aminobutyric acid; MEP, motor-evoked potential.

