Figure 3.
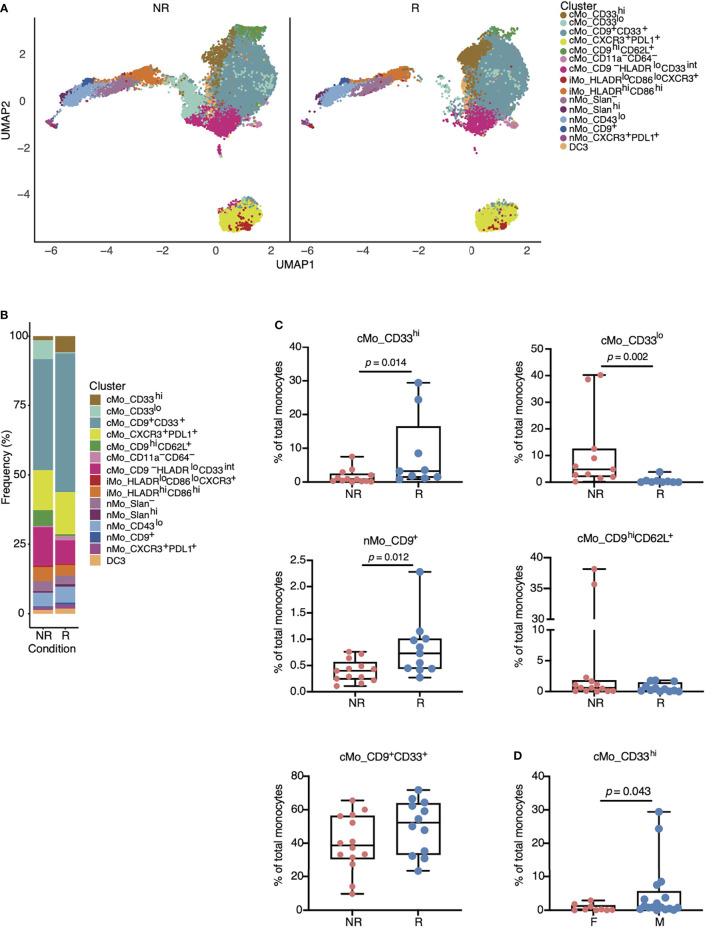
Specific monocyte subsets are associated with responsiveness to anti-PD-1 therapy in patients with NSCLC. (A) UMAP from Figure 2A split amongst NR versus R to anti-PD-1 treatment. Responders displayed increased numbers of cMo_CD33hi (gold) and nMo_CD9+ (dark blue) cells, yet reduced numbers of cMo_CD33lo (aqua) cells. (B) Frequencies of each monocyte cluster in PBMCs from NR versus R based on data from (A). (C) Boxplots indicating statistically significant changes in cMo_CD33hi, nMo_CD9+, and cMo_CD33lo, and non-significant changes in cMo_CD9hiCD33+ and cMo_CD9hiCD62L+. Each dot represents an individual patient. (D) Differences in cMo_CD33hi monocyte subset frequencies between males and females. All p-values displayed in (C, D) were determined by a Mann-Whitney test.

