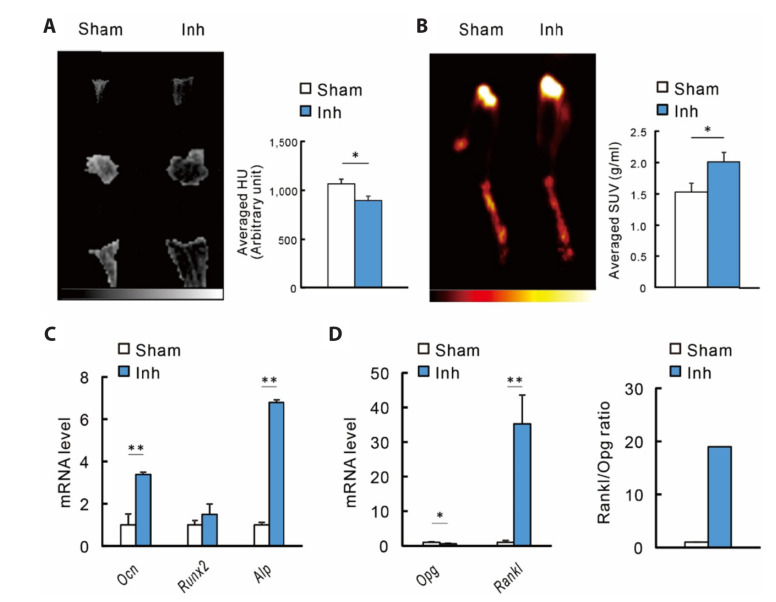
Fig. 2. Effect of FGFR inhibition on bone quality and turnover markers.
Micro/PET-CT mage scan was conducted after FGFR inhibitor (Inh) treatment. (A) Micro-CT scan image of representative animals from each group and summary statistics of averaged HU value. (B) PET-CT scan image of representative animals from each group and summary statistics of averaged SUV (g/ml). Bone turnover markers were measured with qRT-PCR. Gene expression level of (C) osteogenic genes (Osteocalcin, Runx2, and Alp) and (D) osteoclastogenic genes (Opg and Rankl) was normalized with Gapdh. All values are presented as mean ± SEM. FGFR, fibroblast growth factor receptor; PET-CT, positron emission tomography/computed tomography; HU, Hounsfield unit; SUV, standardized uptake values. *p < 0.05, **p < 0.01.

