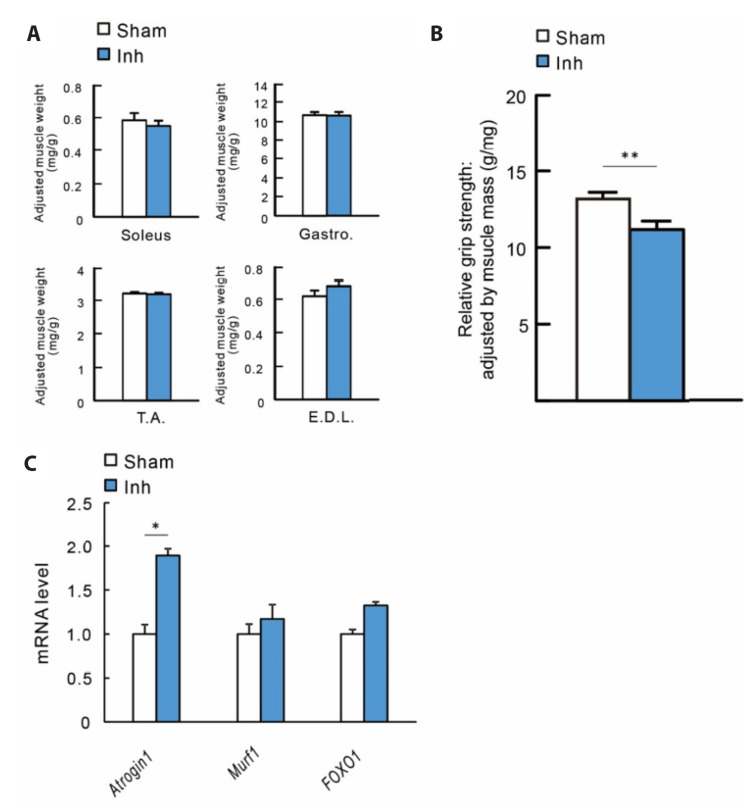
Fig. 3. Effect of FGFR inhibition on muscle quality and skeletal muscle atrophy markers.
Muscle wet weight was adjusted with body weight (A) Soleus, Gastrocnemius, Tibialis anterior and Extensor digitorum longus muscle. (B) Relative grip strength was adjusted by total lower limb muscle mass to evaluate the muscle quality. (C) mRNA expression level of gastrocnemius muscle was measured Atrophy markers were measured with qRT-PCR. Gene expression level of Atrogin1, Murf1, and Foxo1 was normalized with Gapdh. All values are presented as mean ± SEM. FGFR, fibroblast growth factor receptor. *p < 0.05, **p < 0.01.

