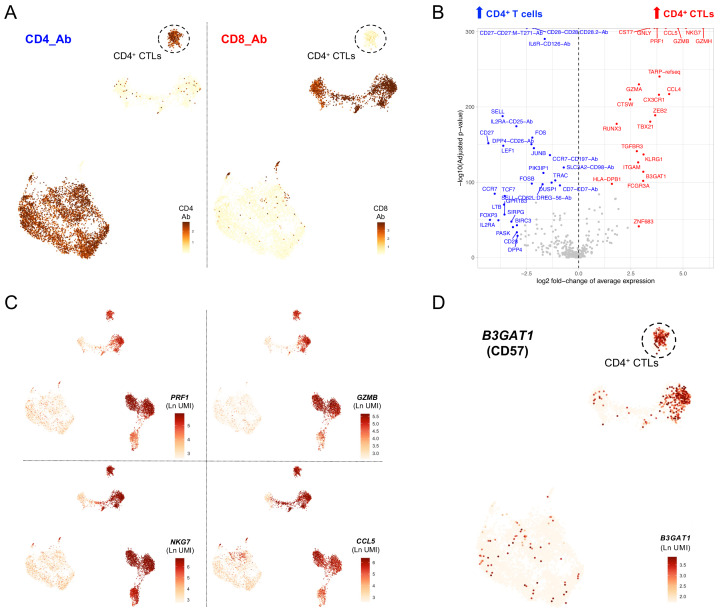
Figure 3. A subset of CD57 + CD4 + T cells with cytotoxic profile is specifically enriched in the IFN hi SLE patient.
( A) Feature plots depicting the expression of CD4 (left) and CD8 (right) at the protein level (AbSeq) on the identified T cell clusters. ( B) Volcano plot depicts the differential expression between the CD4 + CTLs (cluster 10) and the remaining identified CD4 + T cell clusters. ( C) Feature plots depict the expression of four canonical cytotoxic cytokine genes: PRF1, GZMB, NKG7 and CCL5. ( D) Feature plot depicting the expression of B3GAT1, encoding for the surface receptor CD57 on the identified T cell clusters. Ab, AbSeq antibody; CD4 + CTL, cytotoxic CD4 + T cell.

