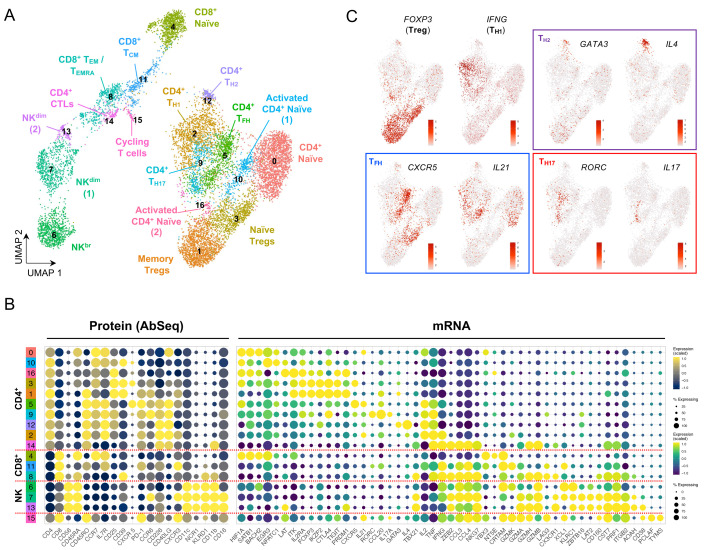
Figure 4. In vitro stimulation polarizes the functional differentiation of CD4 + T cell subsets.
( A) UMAP plot depicting the clustering of the isolated T and NK cells following short in vitro stimulation (90 min) with PMA + ionomycin (N = 11,088 cells passing QC). ( B) Dot plot depicts the expression of select key differentially expressed markers within the identified in vitro stimulated clusters. The size of the dots represents the frequency of the marker in the respective cluster and the colour represents the relative expression level. Protein markers (AbSeq) are shown in the left section of the plot and mRNA markers on the right section. ( C) Feature plots depicting the expression of key lineage defining transcription factors and respective effector cytokine.

