
FIGURE 3.
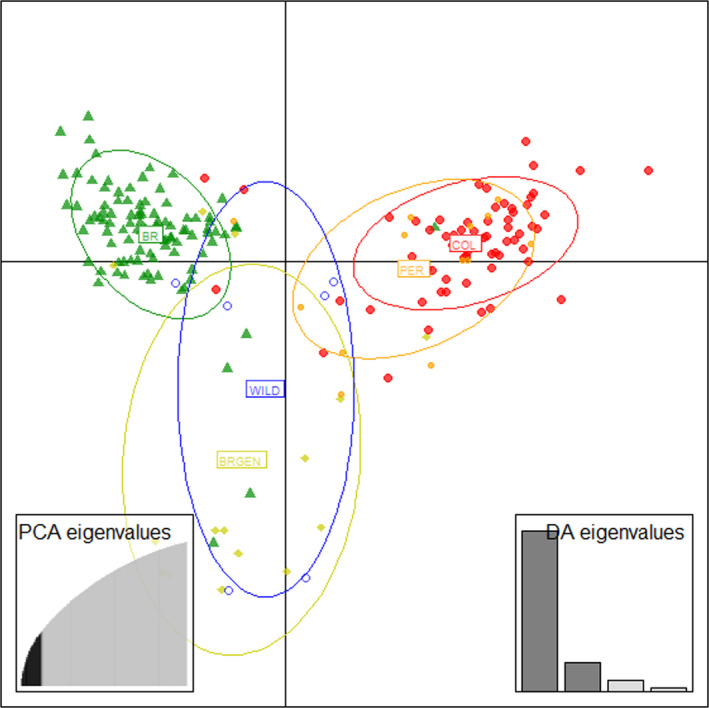
Plot of discriminant analysis of principal components (DAPC) showing relationship of 199 individual fish color coded by sample site, representing the structure between tambaqui stocks from South America. Twenty five PCs were retained using a‐score optimization