
FIGURE 5.
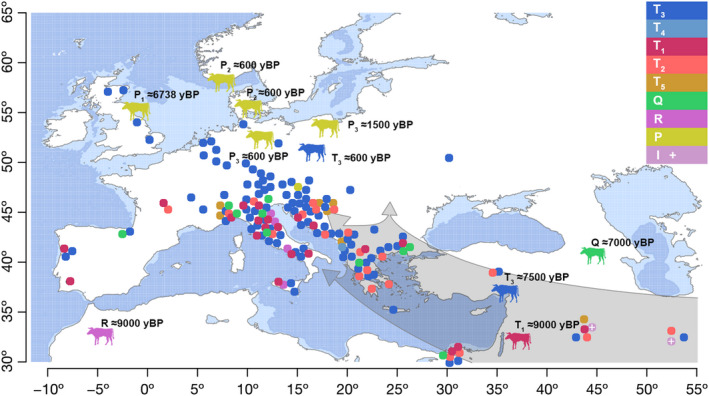
Illustration of the geographical distribution of the analysed mitogenome sequences of European modern cattle breeds with haplogroup assignment according to Bayesian phylogenetic analysis. Aurochs (silhouettes) with sequenced mitogenomes are shown with estimated time of death in years before present (kyBP). Grey shaded arrows indicate agricultural dispersal, while light blue areas show historical sections where grazing may have occurred (sea level 100 m)