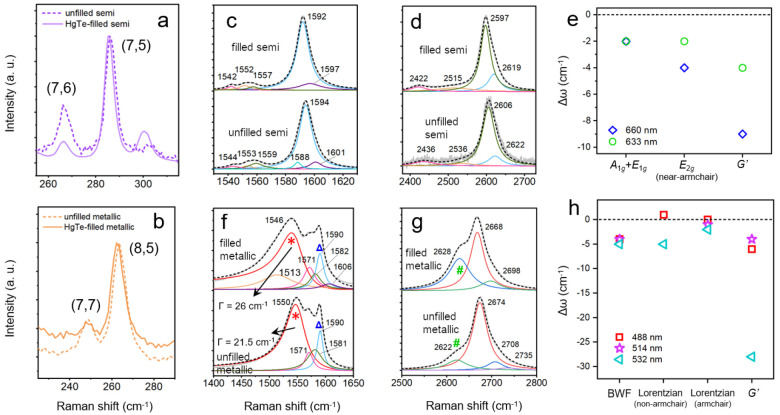
Figure 3.
Raman spectra of the RBMs of (a) semiconducting SWCNTs (under 660 nm excitation) and the (b) metallic SWCNTs (488 nm excitation), with (solid lines) and without (dashed lines) HgTe filling. The (c) G and (d) G′ modes of the semiconducting samples are shown under 660 nm excitation, along with (e) the spectral shifts caused by HgTe filling for the strongest modes. The (f) G and (g) G′ modes of the metallic samples are reported under 514 nm excitation. The BWF line of non-armchair metallic species (red asterisks) and an additional Lorentzian component at 1590 cm–1 (blue triangles) are also shown. The green number sign marks a second component of the G′ mode of the metallic samples. (h) Spectral shifts created by filling the metallic samples.

