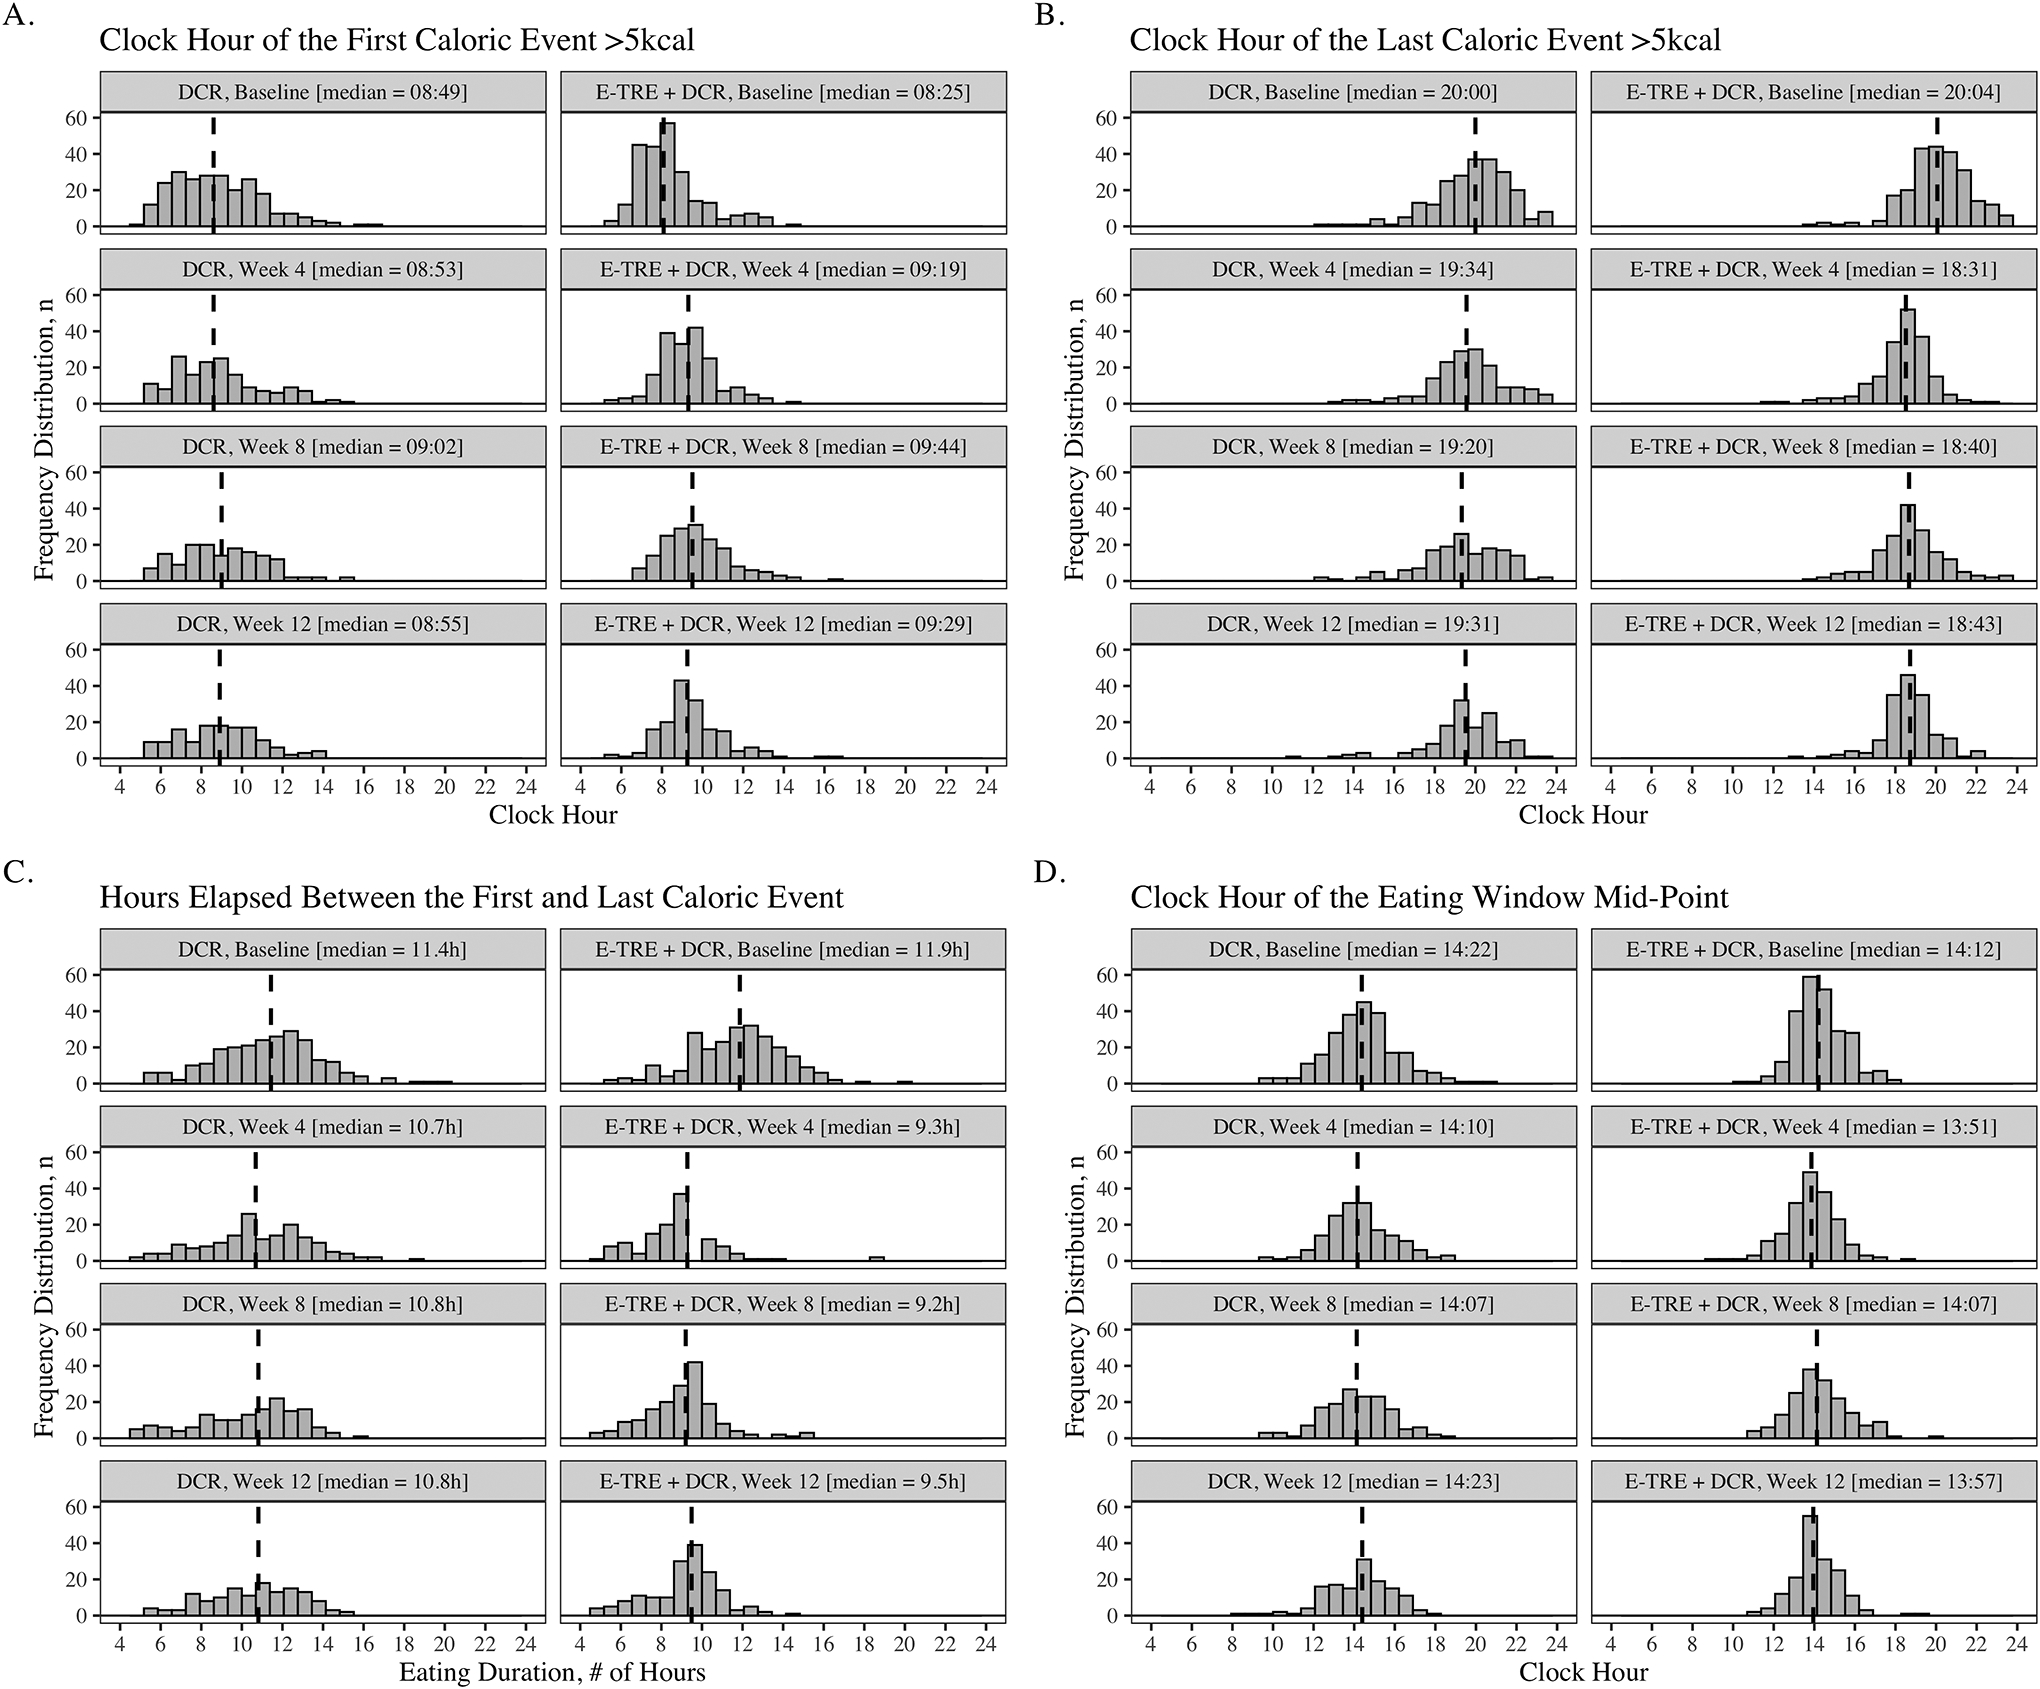
Figure 2.

Histogram plots showing the clock hour of the first caloric event (A), clock hour of the last caloric event (B), total eating duration (C), and the mid-point of the eating window (D) at baseline, week 4, week 8, and week 12 of the DCR and E-TRE interventions, respectively. Dashed lines indicate the median response.
