Figure 3.

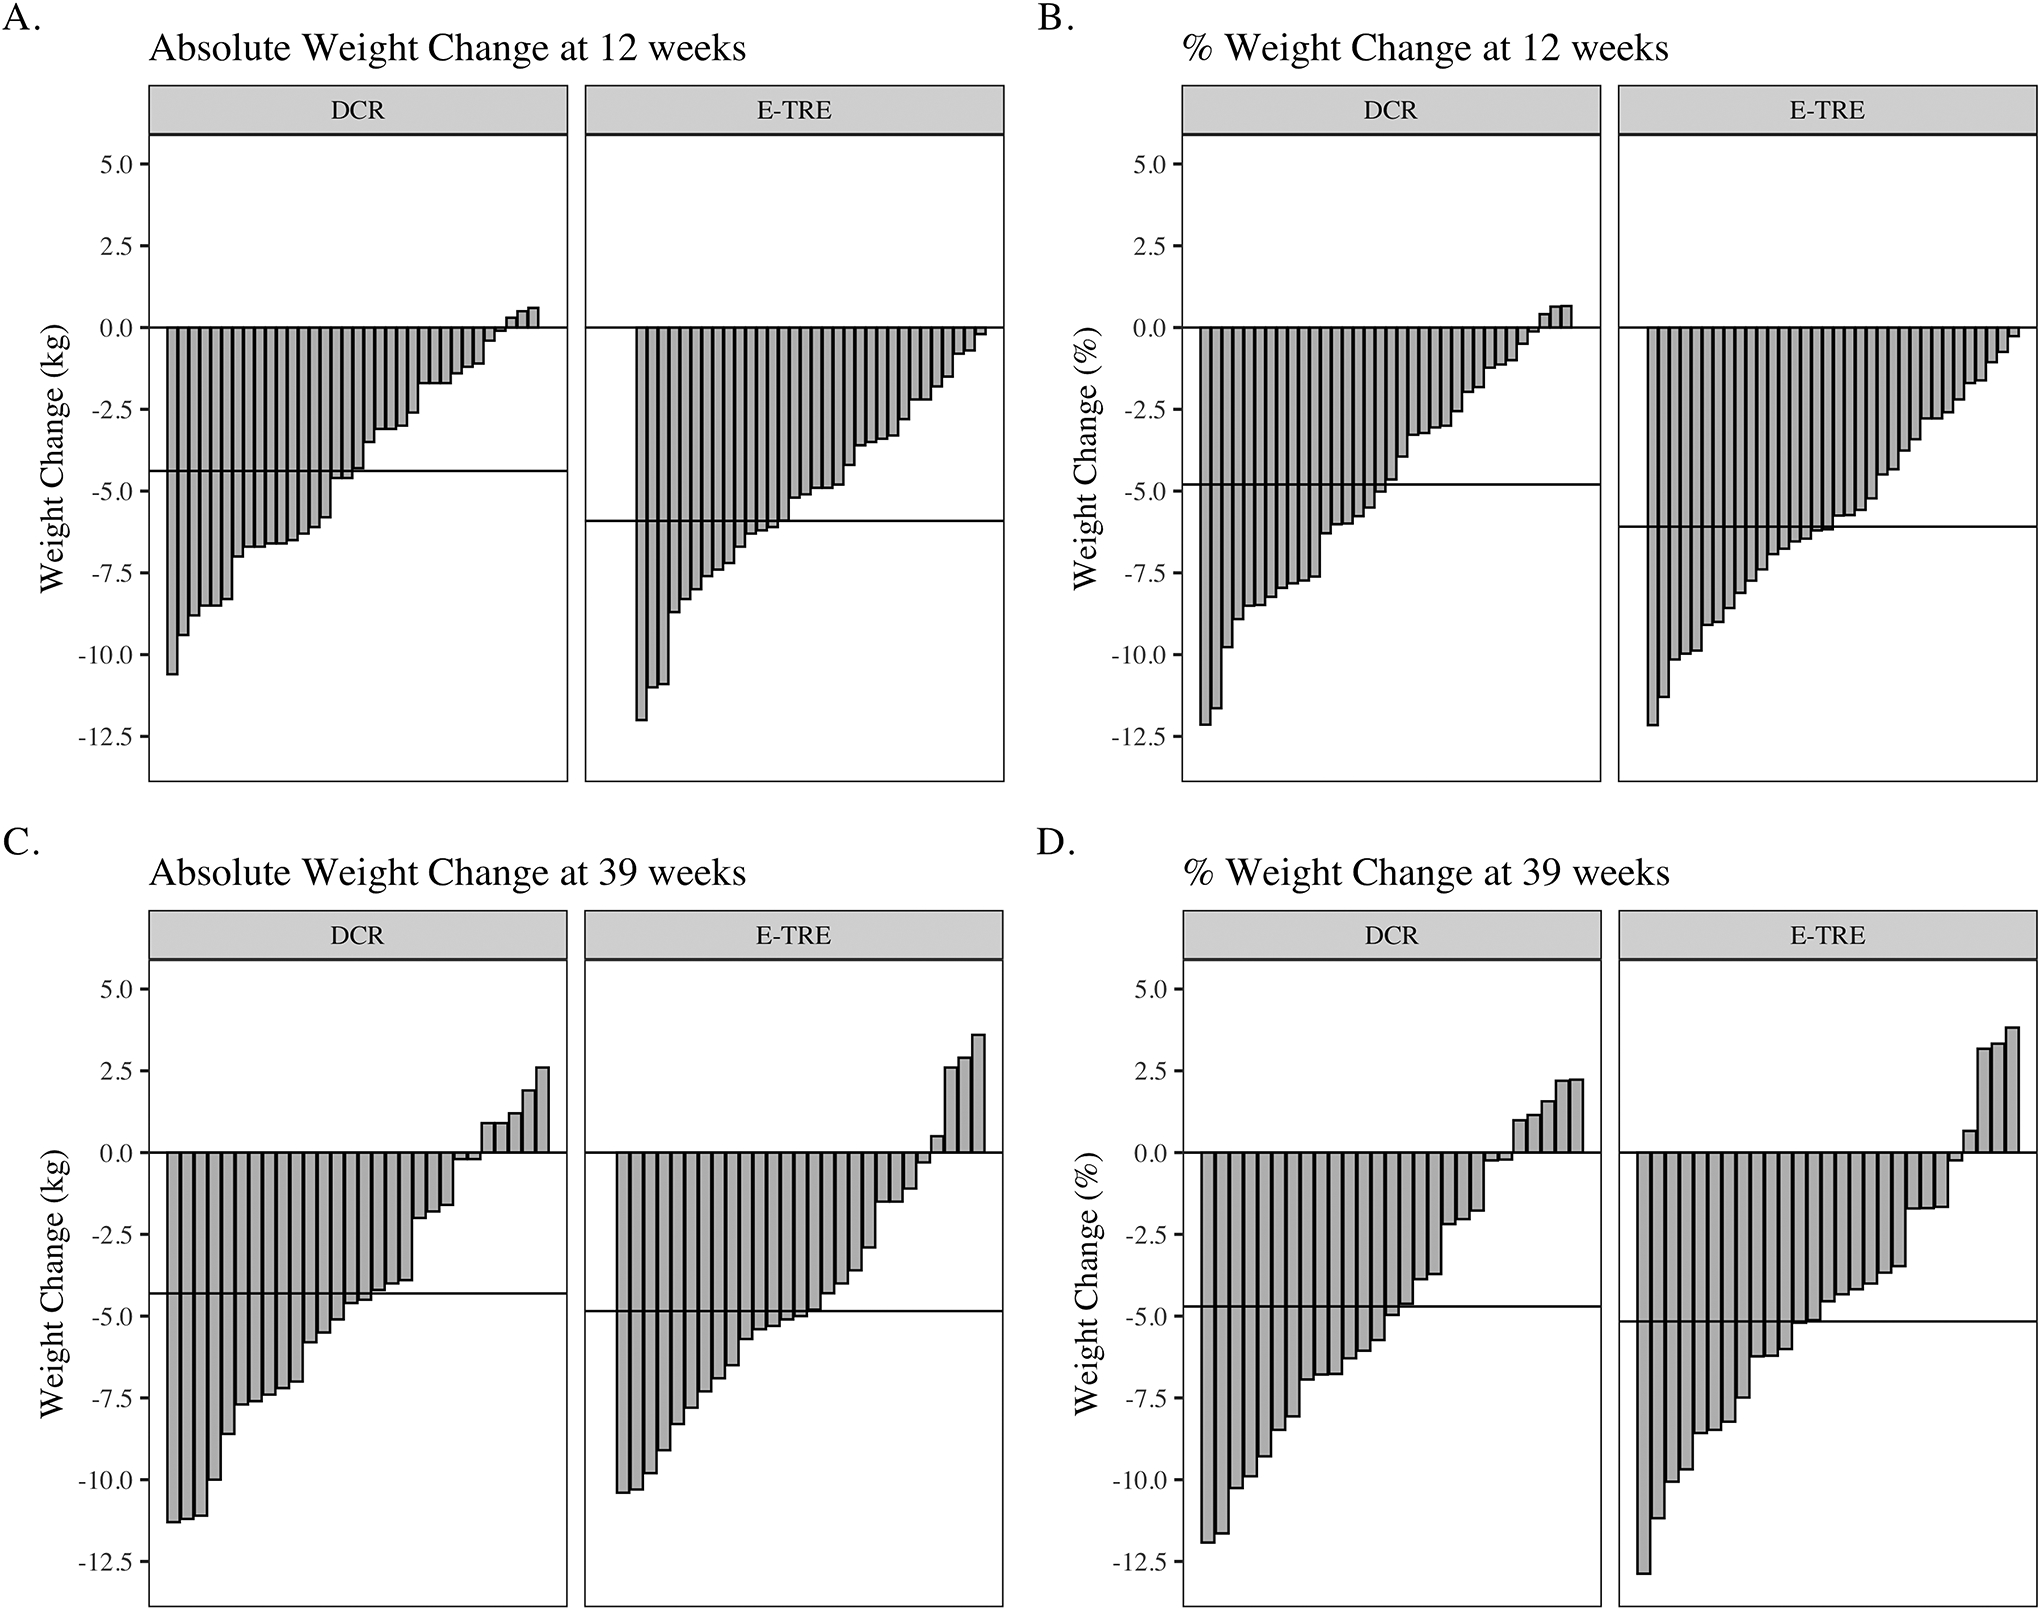
Waterfall plots showing individual (bars) and mean (horizontal lines) weight changes in response to the DCR and E-TRE interventions at study week 12 (A and B) and week 39 (C and D), compared to baseline weight.

Waterfall plots showing individual (bars) and mean (horizontal lines) weight changes in response to the DCR and E-TRE interventions at study week 12 (A and B) and week 39 (C and D), compared to baseline weight.