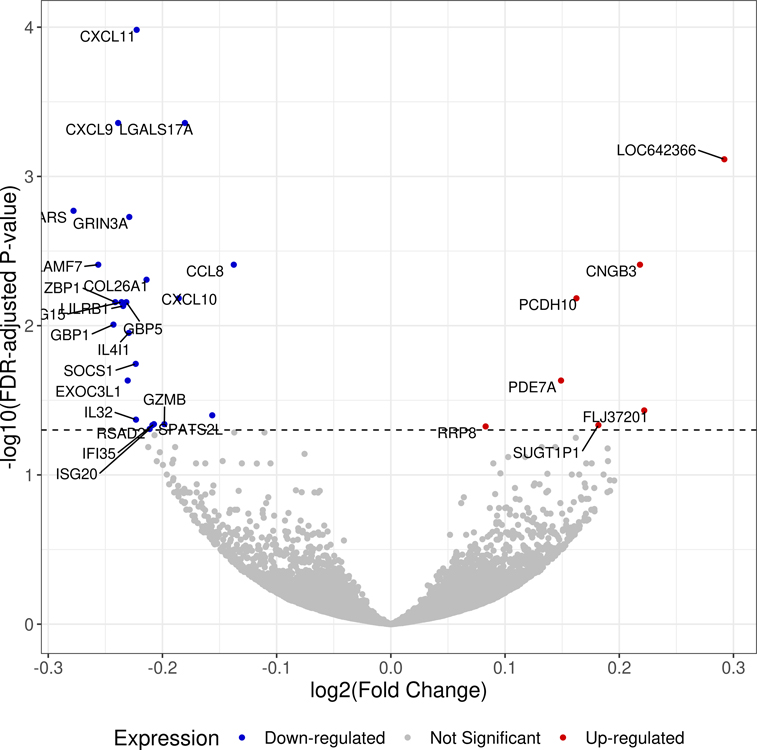
Figure 1.
Volcano plot showing the log2 (fold change) and −log10 (FDR-adjusted P-value) of all the genes in the transcriptome-wide meta-analysis of the two study cohorts.
Footnote: Genes that are differentially expressed between overweight or obese subjects with asthma and subjects with asthma of normal weight are colored in red (up-regulated) and blue (down-regulated). Statistical significance for differential expression is defined as a false discovery rate (FDR)-adjusted P-value < 0.05.

