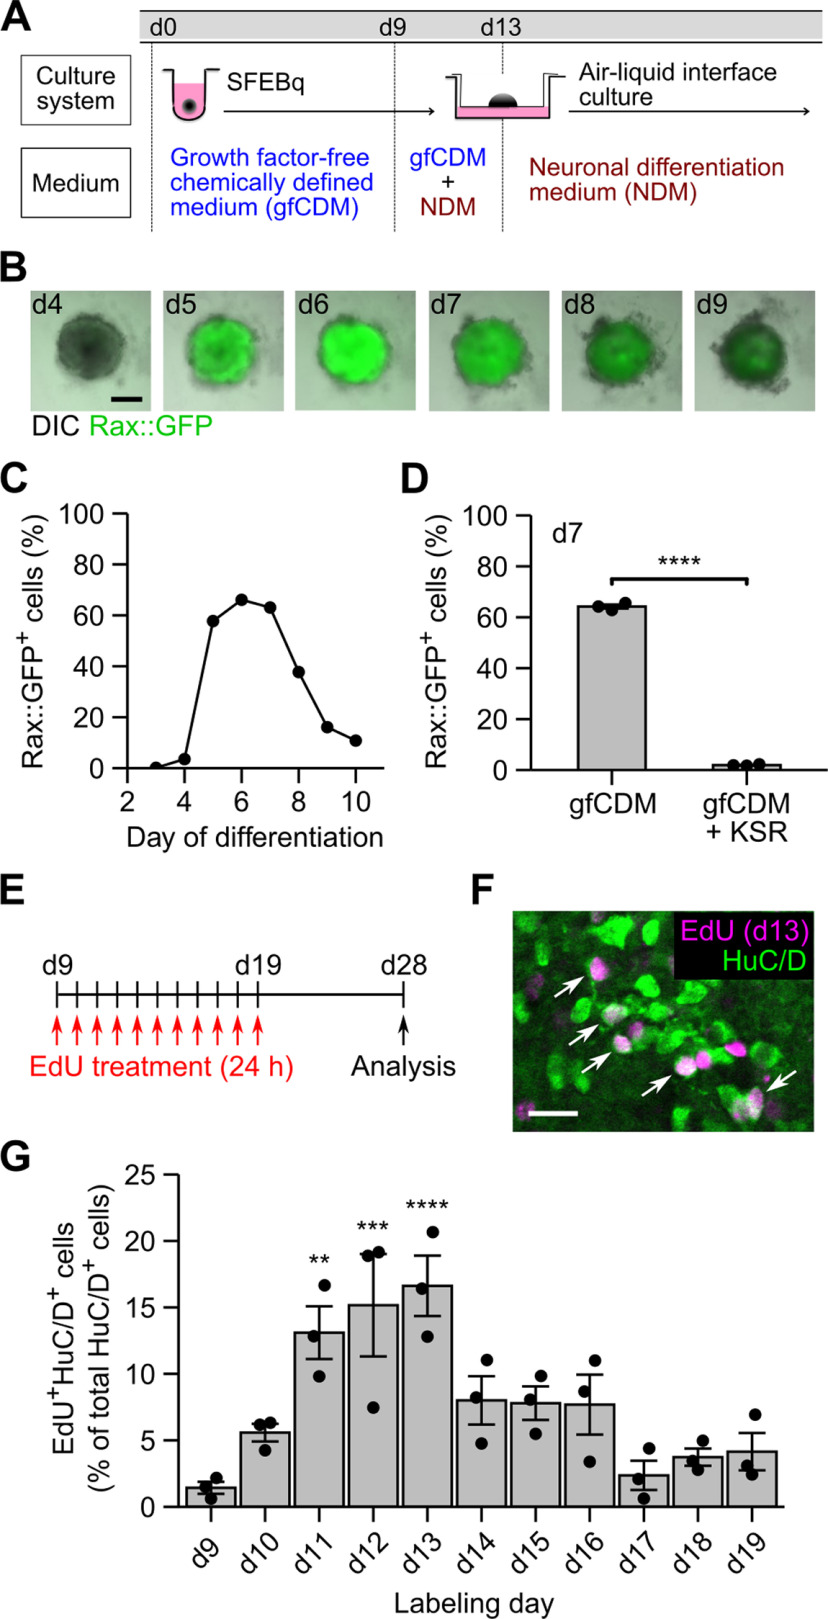
Figure 1.
Temporal pattern of neuronal differentiation in ES-Hypo. A, Culture protocol for ES-Hypo induction. d, day. B, Fluorescence images of SFEBq aggregates showing the Rax::GFP expression during days 4–9. Scale bar: 200 μm. C, The percentage of Rax::GFP+ cells during days 3–10 in a single experimental batch. D, The percentage of Rax::GFP+ cells on day 7 in multiple experimental batches (n = 3). SFEBq culturing were performed in normal differentiation medium (gfCDM) or KSR-supplemented differentiation medium (gfCDM + KSR). ****p < 0.0001 by Welch’s t test. E, A schematic illustration of the birth-dating analysis of postmitotic neurons in ES-Hypo. F, A representative image of day-28 ES-Hypo stained for EdU and HuC/D. The cell aggregate was treated with EdU on day 13. Arrows indicate double-positive cells (i.e., postmitotic neurons born on day 13). Scale bar: 20 μm. G, Summary of the birthdates of postmitotic neurons in ES-Hypo. The percentage of EdU+HuC/D+ cells among total HuC/D+ cells was quantified for each day of EdU labeling. n = 3 aggregates per day. **p < 0.01, ***p < 0.001, and ****p < 0.0001 versus day 9 by Dunnett test.

