Figure 5.

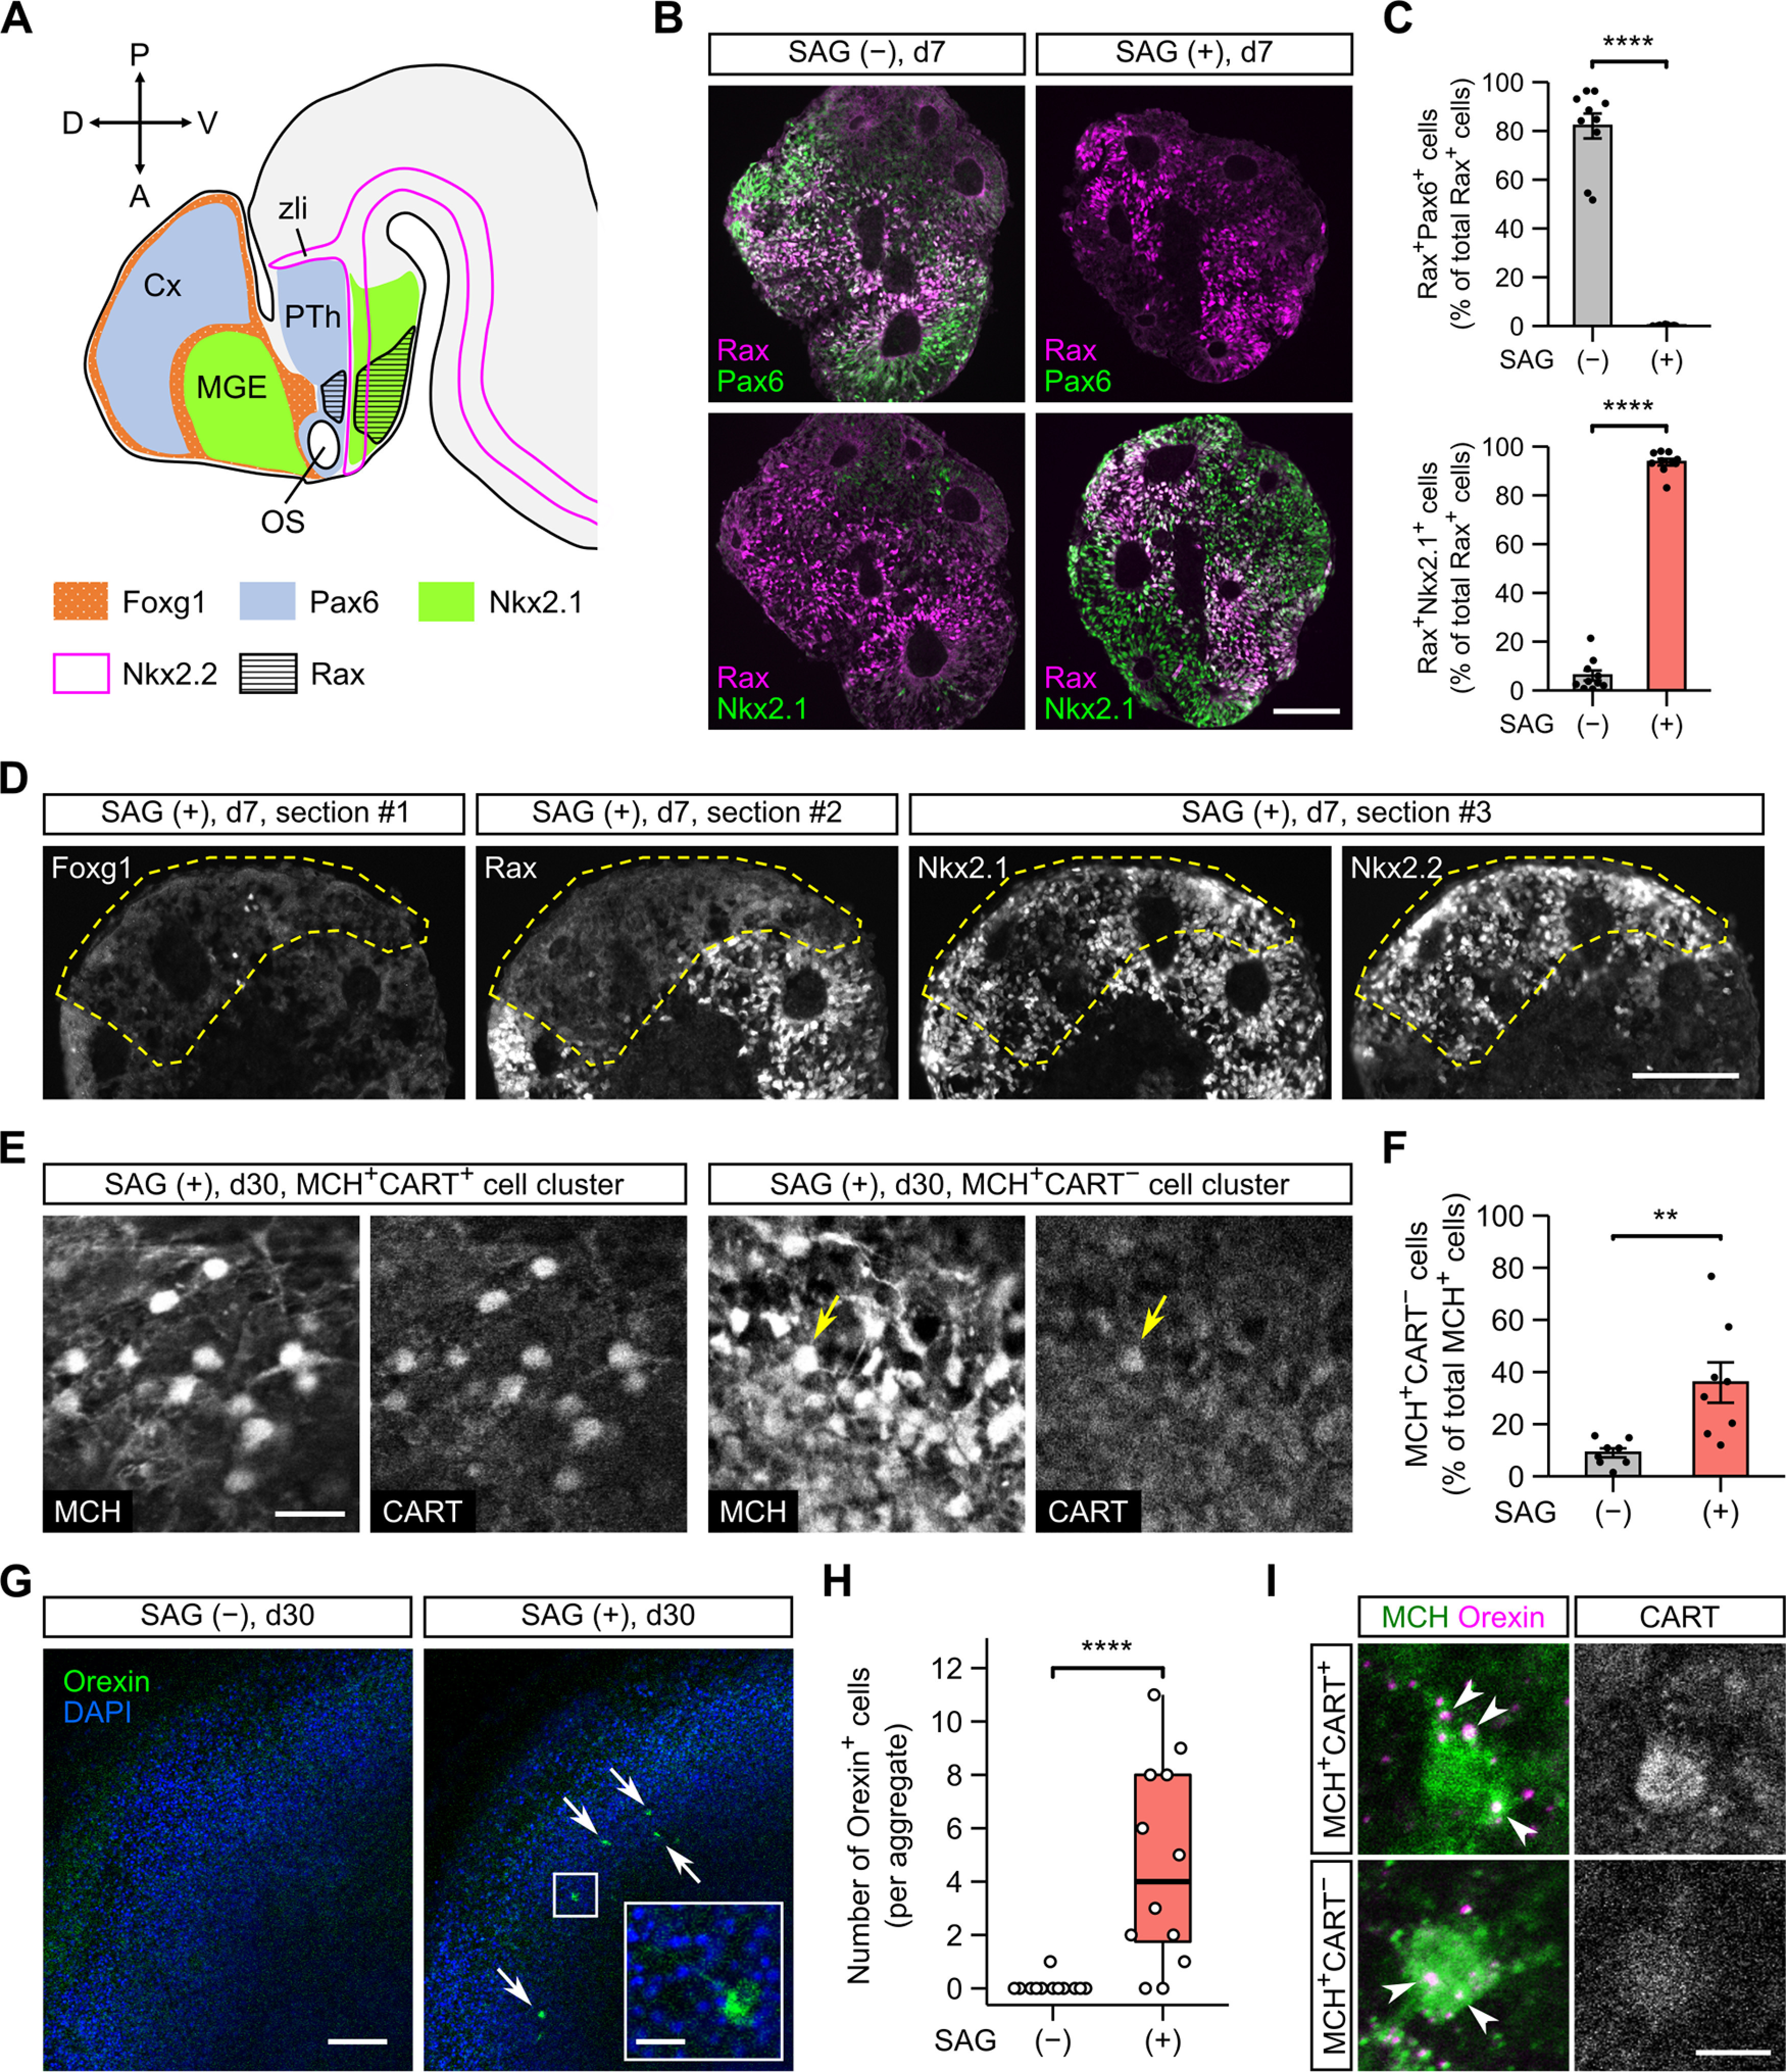
The generation of CART-negative MCH neurons and orexin neurons is increased by the activation of Hh signaling in ES-Hypo. A, The regional expression of transcription factors in the telencephalon and anterior diencephalon of embryonic mouse brain around E12. The indicated expression patterns are based on the published literature (Shimamura et al., 1995; Marín et al., 2002; Shimogori et al., 2010; Lu et al., 2013; Díaz et al., 2014; Ferran et al., 2015). Cx, cortex; MGE, medial ganglionic eminence; OS, optic stalk; PTh, prethalamus; zli, zona limitans intrathalamica. B, Representative images of day-7 mESC aggregates immunostained for Rax and Pax6 (upper panels) or Nkx2.1 (lower panels). The aggregates were differentiated in the absence (−) or presence (+) of 30 nm SAG. Scale bar: 100 μm. Immunostaining for the general neural progenitor marker Sox1 is presented in Extended Data Figure 5-1. C, The percentage of Rax+ cells expressing Pax6 (top) or Nkx2.1 (bottom) on day 7 under SAG (−) and (+) conditions. n = 10 aggregates per condition. ****p < 0.0001 by Welch’s t test. D, Serial sections from a day-7 aggregate cultured with SAG. The sections were stained for Foxg1 (#1), Rax (#2), or Nkx2.1/Nkx2.2 (#3). A Rax− region is surrounded by dashed lines. Scale bar: 100 μm. E, Representative immunofluorescence images of MCH+CART+ (left) and MCH+CART− (right) cell clusters in SAG-treated aggregates on day 30. In the MCH+CART− cluster, only one MCH+ cell is weakly stained for CART (arrow). Scale bar: 20 μm. In Extended Data Figure 5-2, we assessed the co-expression of MCH and HuC/D in SAG-treated aggregates. In Extended Data Figure 5-3, we assessed the co-expression of CART and NK3R in SAG-treated aggregates. F, The percentage of MCH+CART− cells among total MCH+ cells on day 30 under SAG (−) and (+) conditions. n = 8 aggregates per condition. **p < 0.01 by Welch’s t test. G, Representative images of SAG-treated (right) and untreated (left) aggregates immunostained for orexin on day 30. Arrows indicate orexin-ir cells. The inset shows a magnified view of an orexin-ir cell in the boxed region. Scale bars: 100 and 20 μm (inset). H, Quantification of orexin+ cells on day 30 under SAG (−) and (+) conditions. n = 12 aggregates per condition. ****p < 0.0001 by Brunner–Munzel test. I, Representative images of an MCH+CART+ (top) or MCH+CART− (bottom) cell, which is contacted by orexin-ir boutons (arrowheads). Triple immunostaining was performed in SAG-treated aggregates on day 36. Scale bar: 10 μm.
