
Figure 7.
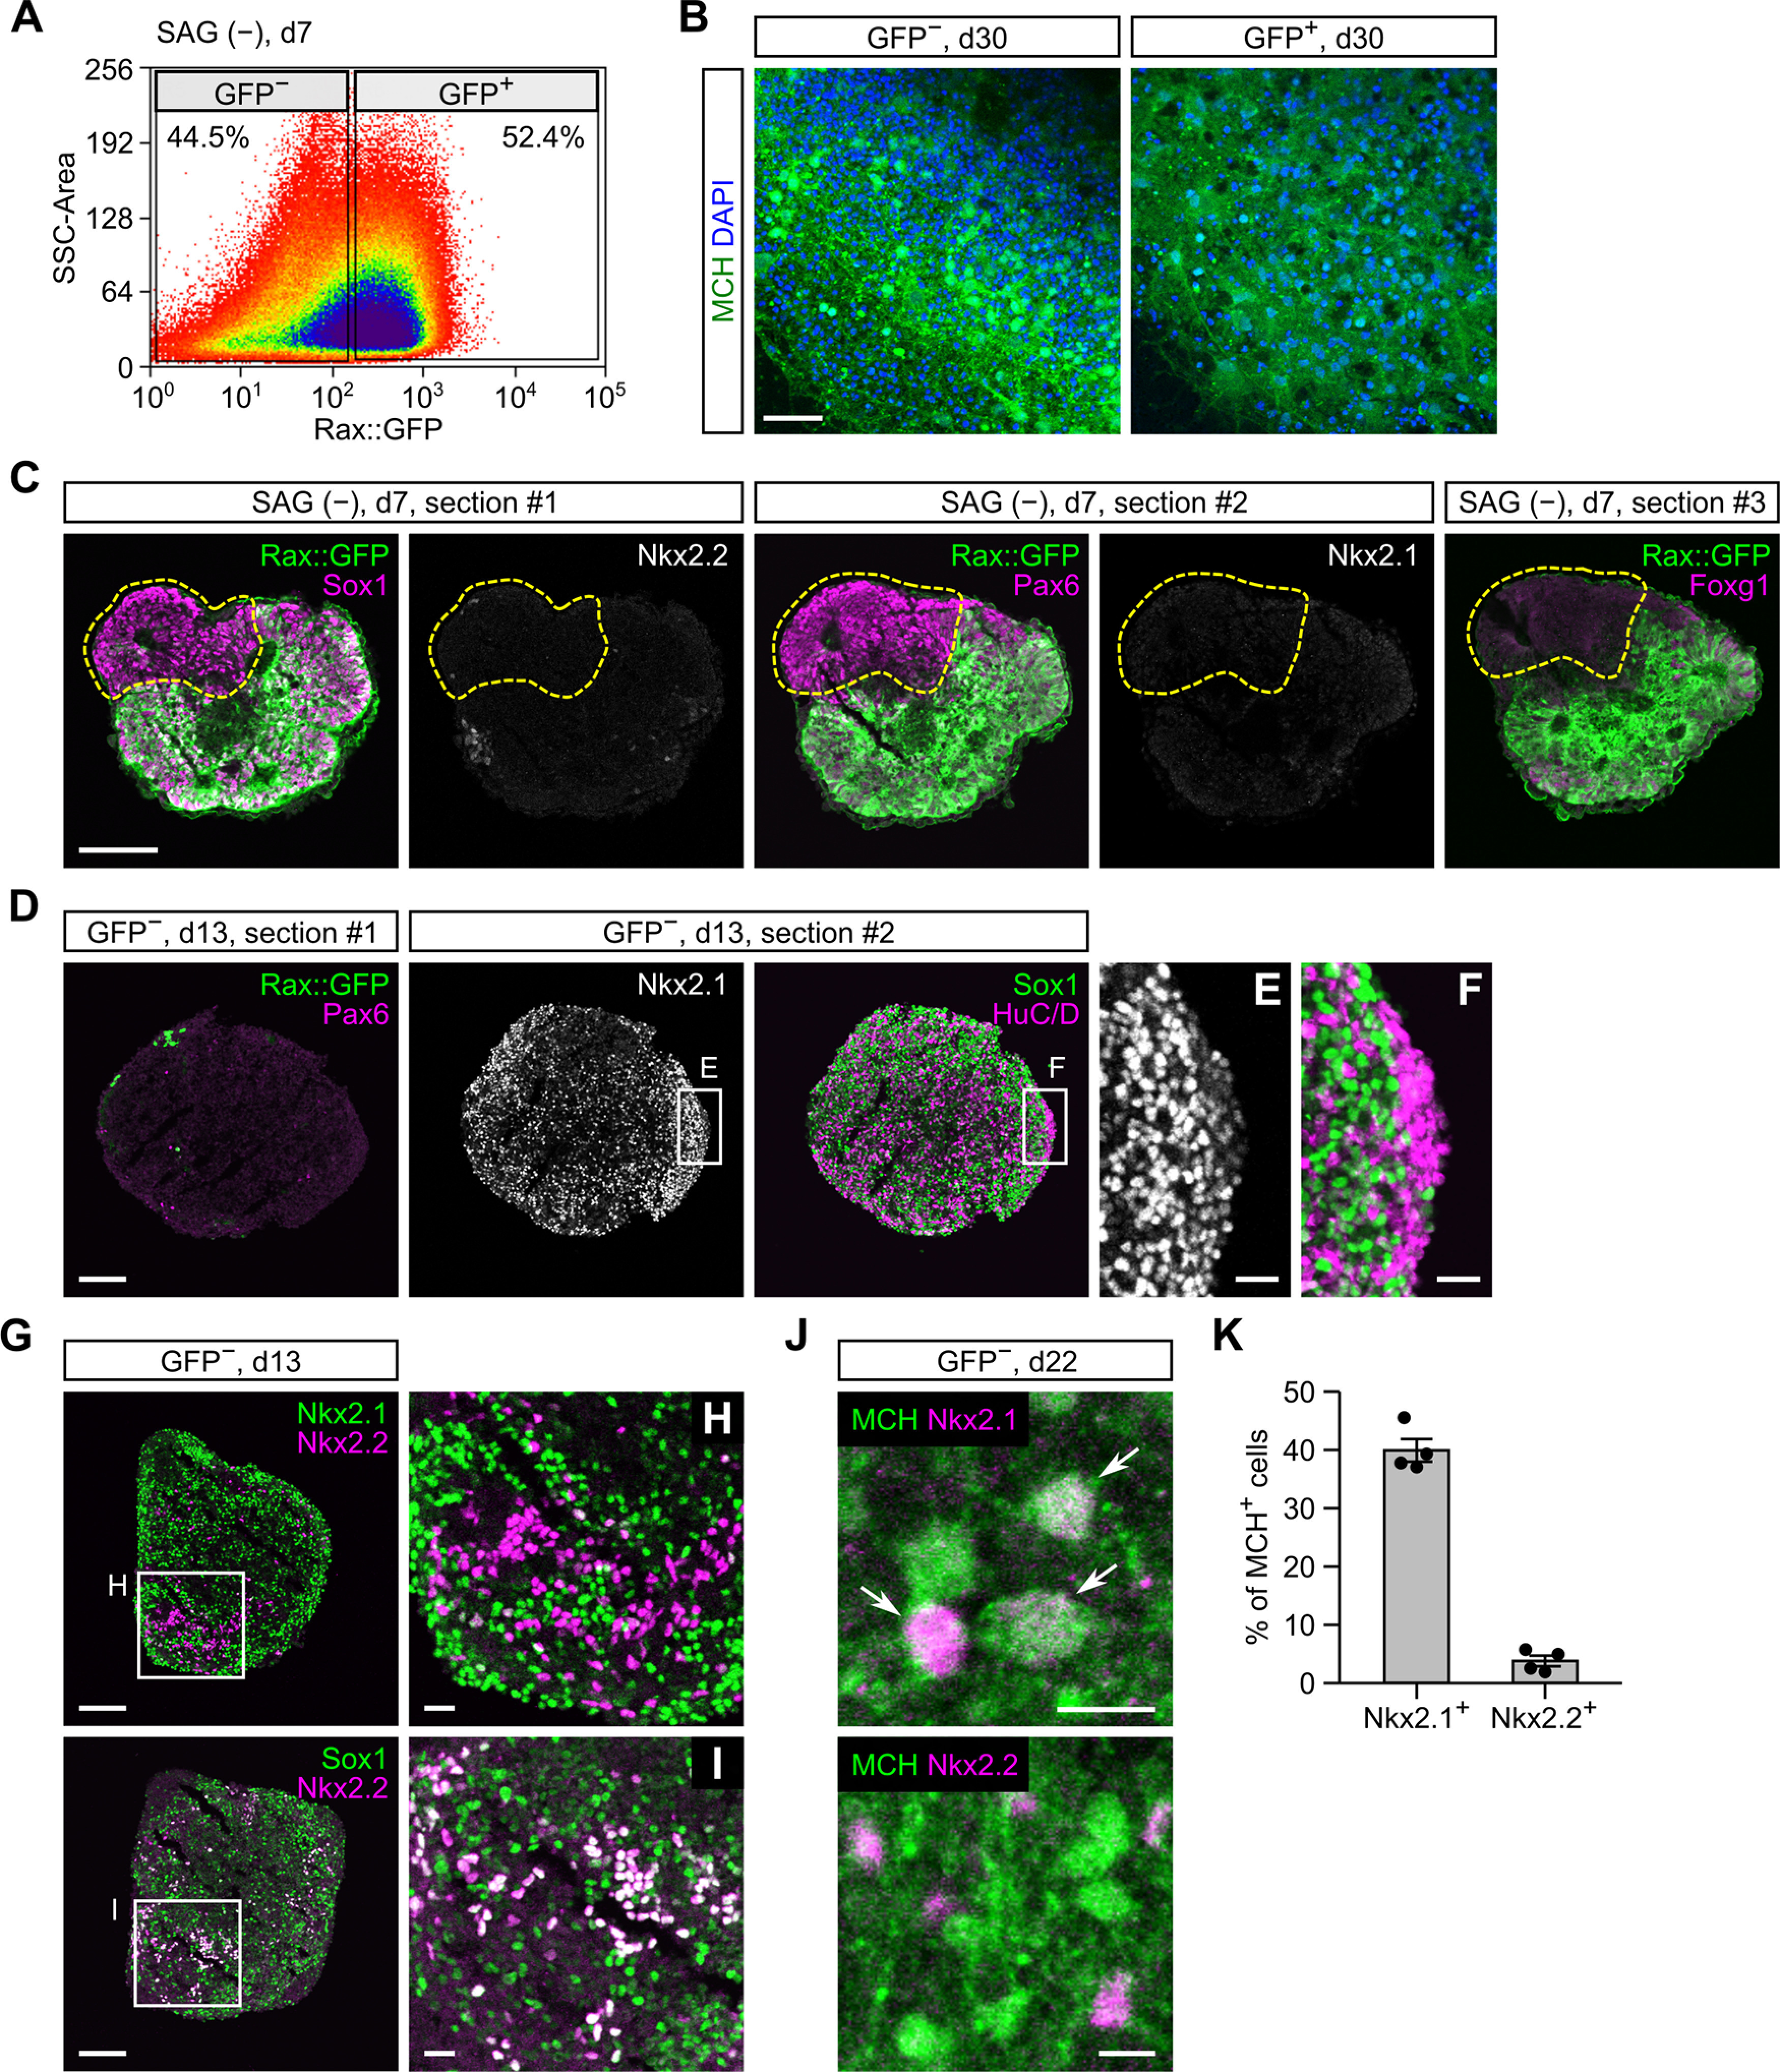
Characterization of neuronal differentiation in SAG-free ES-Hypo. A, FACS sorting of Rax::GFP+ and GFP− cells from SFEBq-cultured mESC aggregates (without SAG) on day 7. B, Immunofluorescence images of Rax::GFP+ (right) and GFP− (left) cell aggregates. FACS-sorted GFP+ and GFP− cells were reaggregated and cultured until day 30 before staining for MCH. Nuclei were stained with DAPI. Scale bar: 50 μm. C, Serial sections from a day-7 aggregate cultured without SAG. The sections were immunostained for GFP/Sox1/Nkx2.2 (#1), GFP/Pax6/Nkx2.1 (#2), or GFP/Foxg1 (#3). Scale bar: 100 μm. D–J, Immunofluorescence analysis of GFP− cell aggregates on days 13 and 22. Two serial sections from a day-13 aggregate were stained for GFP/Pax6 or Nkx2.1/Sox1/HuC/D (D–F). Two sections from a day-13 aggregate were stained for Nkx2.1/Nkx2.2 or Sox1/Nkx2.2 (G–I). Day-22 aggregates were stained for MCH/Nkx2.1 or MCH/Nkx2.2 (J, arrows indicate double-positive cells). Scale bars: 100 μm (D, G), 20 μm (E, F, H, I), and 10 μm (J). K, The percentage of MCH-ir cells expressing Nkx2.1 or Nkx2.2 in GFP− cell aggregates on day 22. n = 4 aggregates per marker.