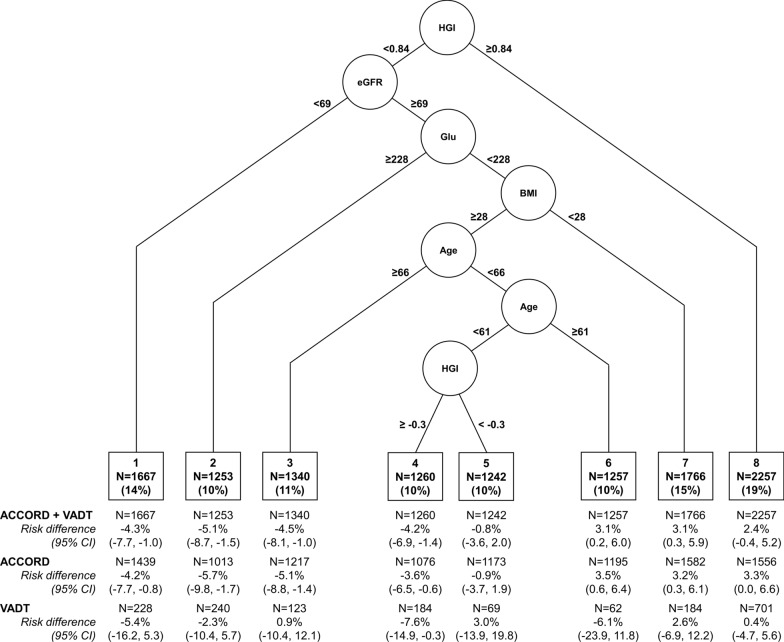
Fig. 1.
Summary causal tree of heterogeneous treatment effects of intensive glycemic control on all-cause mortality. Splitting variables and cut-points for each split are shown, resulting in eight terminal subgroups (N (%) represent number and proportion of participants in pooled ACCORD + VADT sample in each subgroup). Units for splitting variables are mL/min for eGFR (estimated glomerular filtration rate), mg/dL for serum glucose, kg/m2 for BMI (body-mass index), and years for age. Risk difference of MACE and 95% confidence intervals in each subgroup in the pooled sample and in each study alone shown below diagram

