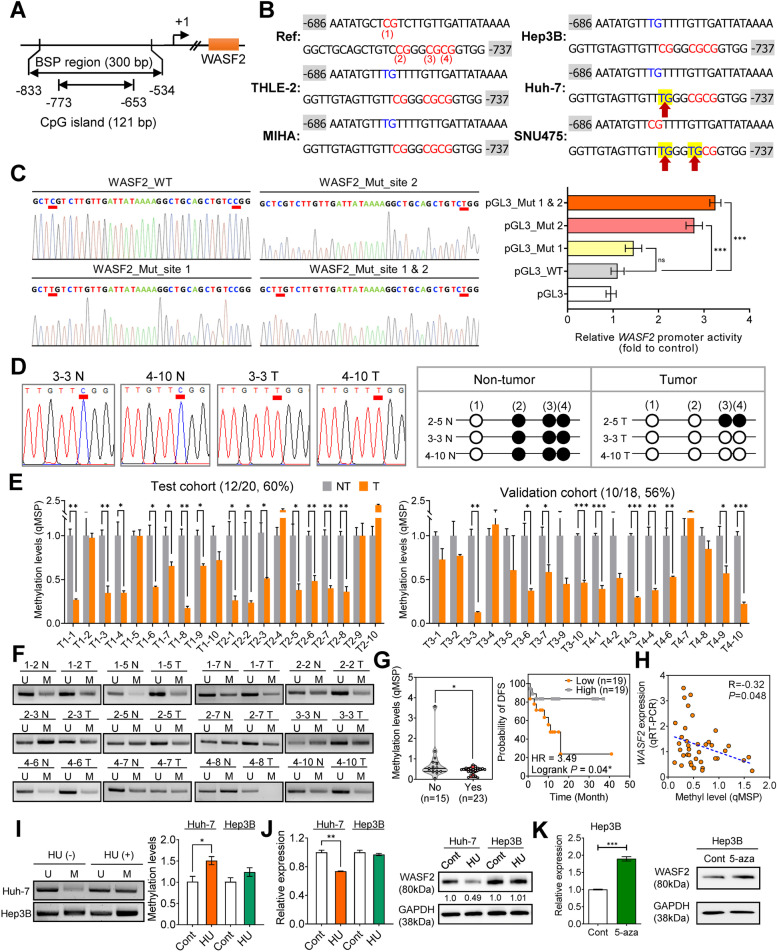
Fig. 5.
Oncogenic WASF2 activation mechanism by methylation in HCC. A The genomic locale of WASF2 and the CpG island in its promoter region. Arrow indicates transcriptional start site. The CpG island region was predicted using MethPrimer and the regions analyzed by BSP are indicated. B Sequence detail of the BSP regions (− 833 to − 534 bp) in the WASF2 gene promoter. CpG dinucleotides (CG) in this region are indicated in red capitals and numbered 1–4. Methylation status of CpGs in the WASF2 promoter region in HCC cell lines. Red arrows: sites specifically unmethylated in HCC cells . C BSP image for four luciferase reporter vectors, containing wild type, site 1 mutation only, site 2 mutation only, and site 1 & 2 mutation, respectively. Red underscore indicates mutation site (left). Promoter activity of wild-type WASF2 (pGL3_WT) and mutated WASF2 (pGL3_Mut 1 and 2), analyzed by luciferase assay (right). D Representative direct sequencing of the BSP image (left) and dot plots of methylation status of CpG site 2 (− 726 bp) in human HCC tissues (right). White and black dots indicate unmethylated and methylated CpGs, respectively. E Bar chart of CpG methylation in the WASF2 promoter in the test cohort (top; n = 20) and validation cohort (bottom; n = 18) determined by MSP in paired tumor (T) and non-tumor (NT) tissues. F Representative gel images of MSP results. Primers are specific for unmethylated (U) or methylated (M) DNA. G Violin plot (left) of WASF2 methylation based on the vascular invasion status of the test and validation cohorts [without invasiveness, No (n = 15); with invasiveness, Yes (n = 23); * P < 0.05]. Disease-free survival of HCC patients with low or high WASF2 DNA methylation (right). P values determined by the log-rank test. H Correlation of WASF2 methylation status and its expression in 66 HCC tissues. I Methylation status (left) and levels (right) of WASF2 in Huh-7 and Hep3B cells with/without HU treatment. J WASF2 mRNA (left) and protein (right) expression in Huh-7 and Hep3B cells with/without HU treatment. K WASF2 mRNA and protein expression in Hep3B cells with/without 5-aza treatment. *P < 0.05; **P < 0.01; ***P < 0.001

