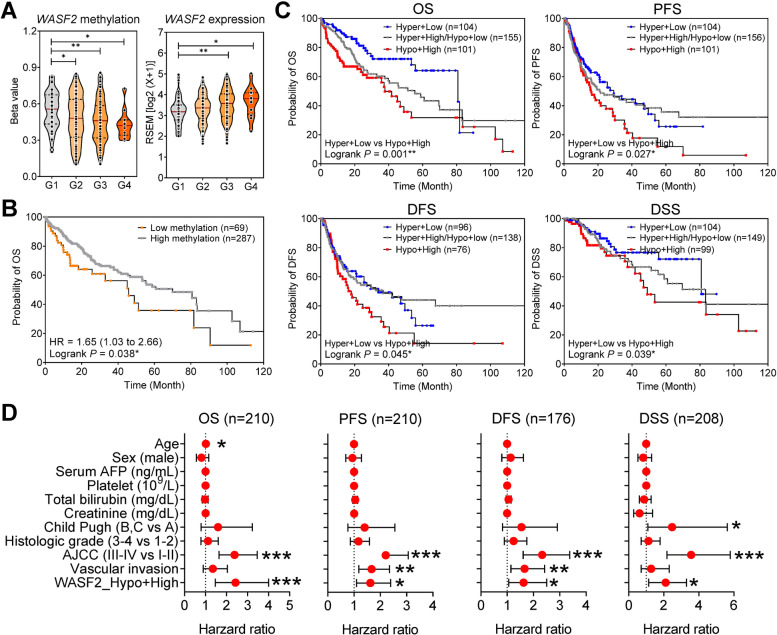
Fig. 6.
Clinical association between WASF2 methylation and overexpression. A Differences in cg24162579 CpG site methylation in the WASF2 promoter region according to HCC tumor grade (left). Differences in WASF2 expression according to HCC tumor grade (right). B Overall survival curves according to cg24162579 CpG site methylation in TCGA_LIHC dataset. C Overall survival, progression-free survival, disease-free survival, and disease-specific survival curves according to the level of WASF2 methylation and expression in the TCGA_LIHC dataset. D Forest plot of univariate Cox regression analyses of clinical parameters on overall survival, progression-free survival, disease-free survival, and disease-specific survival *P < 0.05; **P < 0.01; ***P < 0.001. HCC differentiation was defined using the Edmondson grade scale (grade 1, G1; grade 2, G2; grade 3, G3; and grade 4, G4)

