Figure 2.

Establishing safety and efficiency of the dTAG system in pre-implantation stages.
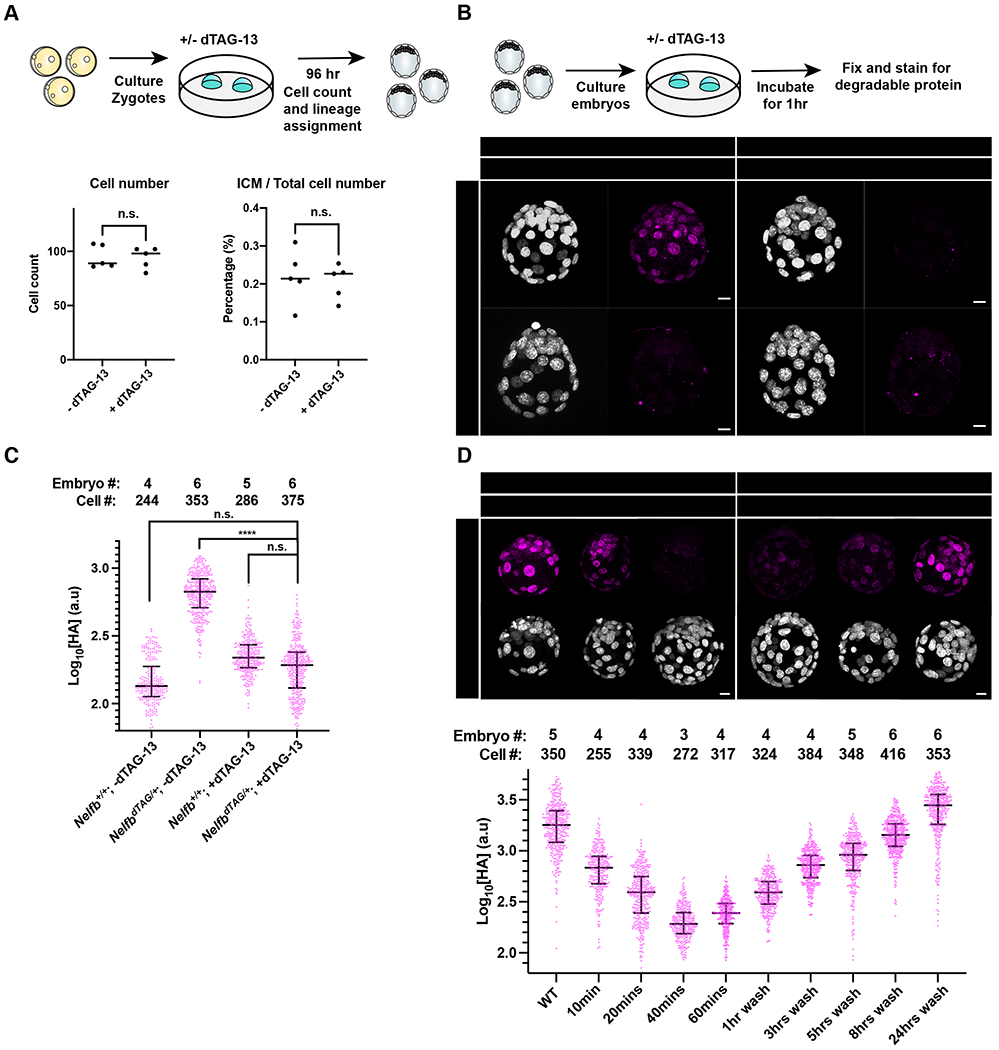
(A) (Top) Schematic representation of experimental design to test dTAG-13 safety in pre-implantation culture from zygote to blastocyst stages. (Bottom) Dot plots showing total cell counts (left) or percent ICM cells (right). Cell counts were determined following Hoechst staining and nuclei counting. ICM cells were identified via NANOG/GATA6 staining. Individual dots represent single embryos. Bars represent group means.
(B) (Top) Schematic representation of experimental design to determine efficacy of tagged protein degradation. E3.5 blastocysts were cultured +/− 500nM dTAG-13 for 1hr prior to fixation and immunostaining. (Bottom) Immunofluorescence of HA to determine degradation of tagged protein. Nuclei labeled with Hoechst. Total cell count per embryo is shown in the top left corner. Scale bar, 10μm.
(C) Quantification of mean HA signal intensity per nucleus. Wild type embryos used to show background fluorescence with staining.
(D) (Top) E3.5 immunofluorescence of HA to determine degradation of tagged protein following several indicated incubation periods or following degradation and recovery in dTAG-13-free medium. Nuclei labeled with Hoechst. (Bottom) Quantification of mean HA signal intensity per nucleus. Scale bar, 10μm.
For all experiments, maximum intensity projection (MIP) is shown in images. Plots show each data point with group mean and interquartile range. Student t-test was used to determine significance. Statistical significance is classified based on p-value as: n.s. > 0.05, * < 0.05, ** < 0.01, *** < 0.001, **** < 0.0001.
