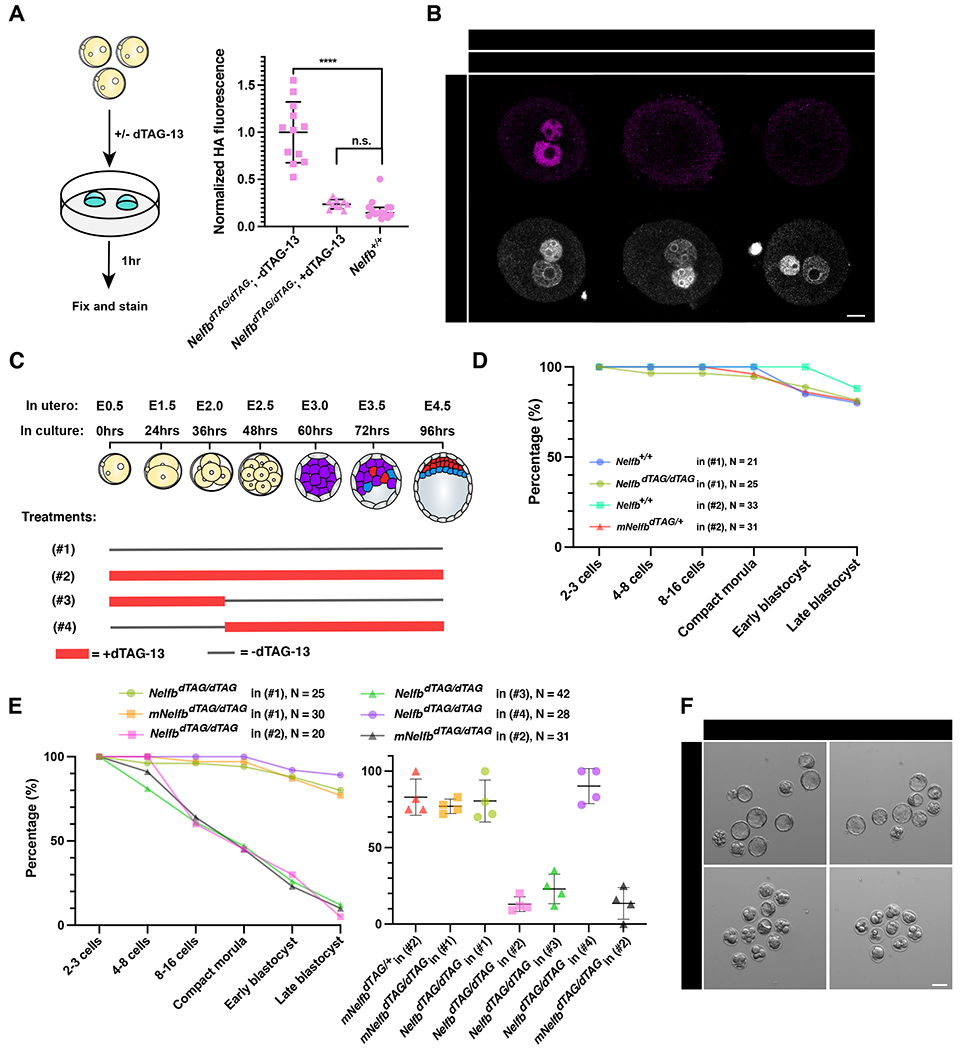
Figure 5.

NELFB is required for pre-implantation development during zygote-2-cell stage.
(A) (Left) Schematic of testing the dTAG system in zygotes. Homozygous NelfbdTAG/dTAG embryos were collected at E0.5 and cultured with or without 500nM dTAG-13 for 1hr. (Right) Quantified mean HA signal in zygotes +/− 1 hr dTAG-13. Each dot represents a pro-nuclei. HA signal is normalized to non-treated embryos.
(B) Immunofluorescence images of zygotes retrieved after 1hr culture +/− dTAG-13. Pro nuclei were labeled with Hoechst. Scale bars, 20μm.
(C) Schematic of culture conditions for following panels D and E, showing when dTAG-13 is added and removed for each condition in zygote to blastocyst culture. The treatment numbers: (#1): no dTAG-13, (#2) constant dTAG-13, (#3) 36hrs dTAG-13 from zygote to 4-cell stage followed by washing, (#4) 60hrs dTAG-13 from 4-cell stage to late blastocyst stage.
(D) Average number of embryos reaching the indicated developmental stage per group/treatment. Control conditions are shown. Figure legends show genotype, treatment regiment, and total number of cultured embryos. mNlfb refers to maternal Nelfb genotype.
(E) (Left) Average number of embryos reaching the indicated developmental stage per group/treatment. Control conditions are shown. Figure legends show genotype, treatment regiment, and total number of cultured embryos. Testing conditions are shown with littermate controls in each experiment. (Right) plot shows the average number of embryos successfully reaching late blastocyst stage in each separate litter per condition. mNelfb refers to maternal Nelfb genotype.
(F) Representative images of cultured embryos at hour 96. Scale bars, 50μm.
For all experiments, maximum intensity projection (MIP) is shown in images. Plots show each data point with group mean and interquartile range. Student t-test was used to determine significance. Statistical significance is classified based on p-value as: n.s. > 0.05, * < 0.05, ** < 0.01, *** < 0.001, **** < 0.0001.
