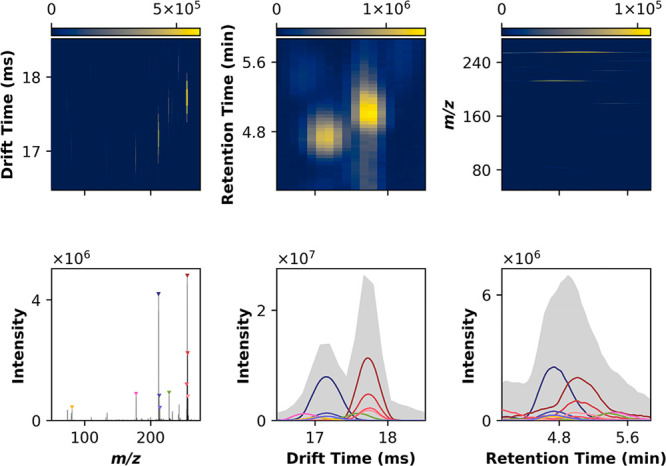
Figure 2.

Multidimensional peak detection. Peak detection involves convolving the input signal in N dimensions (here, in LC-IMS-MS, 3D) with a maximum filter. The input and maximum filtered arrays are then compared point-by-point and, where equal, a local maximum is indicated. While the data is collected in 3D, this approach is best visualized in 2D and 1D projections, capturing all lower dimensional representations of the underlying 3D data. Note a well-defined peak in a given 2D view may or may not correspond to a true 3D apex, or can be the product of multiple underlying features. It is, thus, important to interpret the 1D projections carefully. For this subset of the data, the top 10 most intense local maxima are shown, colored by m/z, with similar m/z (i.e., isopologues) sharing hues.
