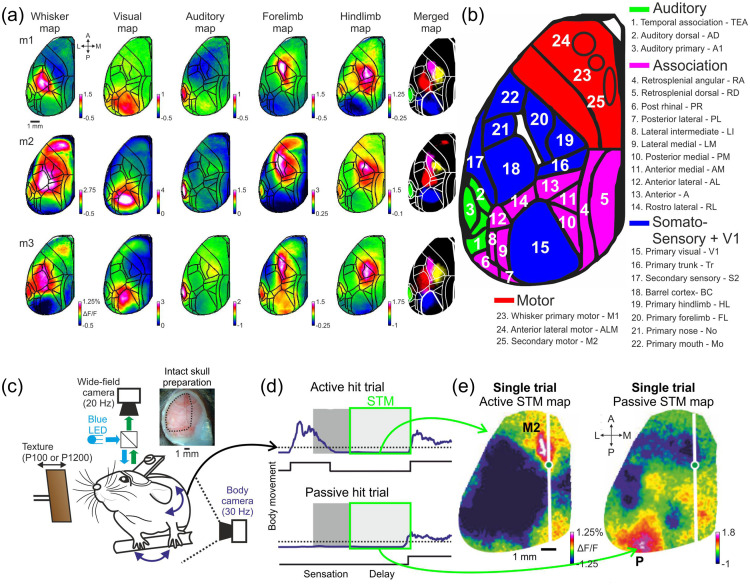
Fig. 18.
Mapping of brain areas and task-induced neuronal activity with mesoscale imaging. (a) Functional mapping of cortical areas. Example maps from three mice (m1, m2, m3) under anesthesia in response to different sensory stimuli: whisker, visual, auditory, forelimb, and hindlimb. Mean evoked activity map is shown for each stimulus type for each mouse. Color denotes normalized fluorescence (ΔF/F). The maps are registered onto the brain atlas (black lines; © 2004 Allen Institute for Brain Science. Allen Mouse Brain Atlas. Available from: http://mouse.brain-map.org/). Overlays of the 5 maps are shown on the right. (b) Parcellation of the dorsal cortical surface into 25 areas. Cortices are color-coded: auditory (green), association (pink), somatosensory + V1 (blue), and motor (red). (c) Behavioral and wide-field imaging setup in mice performing a whisker-dependent memory guided task. (d) Body movement vector in two example hit trials, one active and one passive. (e) Short term memory (STM) maps (averaged during the quiet delay period) for an active and passive trial showing frontal and posterior patches of activity, respectively. Color denotes normalized fluorescence (ΔF/F).

