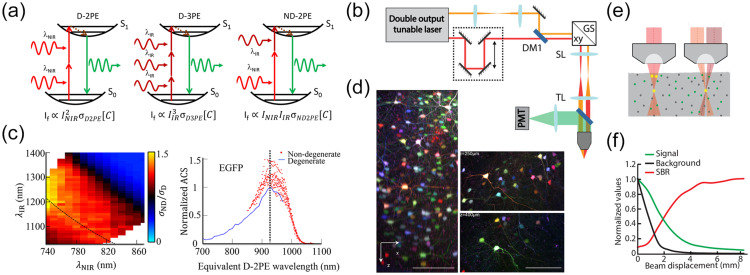
Fig. 26.
ND-2PE with collinear and displaced beams. (a) Schematic Jablonski energy diagram for D-2PE, D-3PE, and ND-2PE. , fluorescence signal intensity; and , intensities of the two laser beams; and , the wavelength of the two laser beams; , , and , cross-sections for D-2PE, D-3PE, and ND-2PE; [C], fluorophore concentration. (b) Simplified schematic of ND-2PE microscope setup: GS-XY, galvanometer scanner; SL, scan lens; TL, tube lens; DM, dichroic mirror; OL, objective lens; PMT, photomultiplier tube. (c) Left: color-coded normalized non-degenerate absorption cross-section for EGFP as a function of the combination of NIR and IR wavelengths. The cross-section value at each combination of wavelengths was normalized by the peak value of this fluorophore. The isocline corresponding to the ground to excited state transition energy is indicated in dashed black line. Right: normalized cross-section values as a function of the equivalent degenerate wavelength are shown in red. Independently measured degenerate cross-section values normalized by its peak within the equivalent range of the total photon energy are shown in black. The black dashed line indicates the position of the peak degenerate absorption used for the normalization procedure (930 nm). These wavelengths correspond to the energy isocline shown in panel (b). (d) Simultaneous excitation of four different fluorescent proteins in Brainbow mouse cortical tissue using ND-2PE with , and . Panel (d) is reproduced with permission from Ref. 473. (e) Left: D-2PE excites the sample both near the surface and within the focal volume. Right: by selecting the two excitation beams for ND-2PE outside of the excitation spectrum of the fluorophores and spatially displacing the beams, the sample is excited only in the focal volume where two beams overlap. (f) Simulation results for the normalized values of signal, background, and SBR versus the beam displacement from the colinear configuration.

