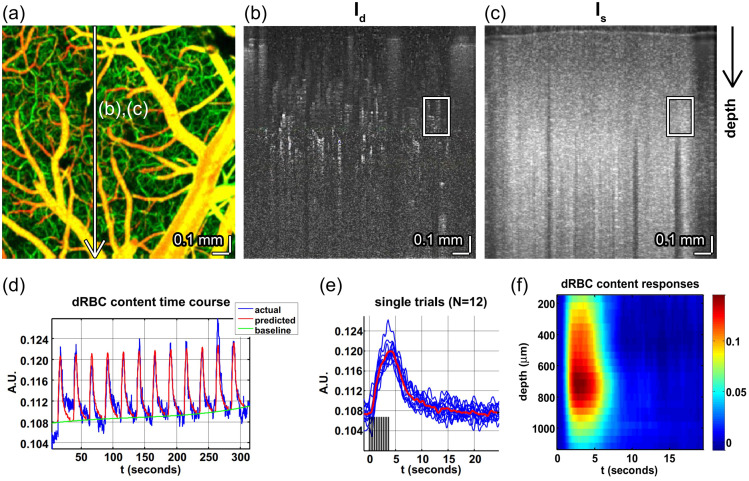
Fig. 31.
Angiography and blood flow measurements with OCT. (a) Depth-resolved OCT angiography of the rat somatosensory cortex.587 Location of OCT cross-sections shown on volumetric angiogram [maximal intensity projection (MIP); superficial vessels in orange-yellow, deep vessels in green]. (b), (c) Cross-sectional angiogram (dynamic intensity, (b)) and static intensity (c) images. (d), (e) Localized changes in dynamic red blood cell (dRBC) content extracted from boxes in (b) and (c), respectively. (f) Depth-resolved measurements show the strongest dRBC responses in middle cortical layers.

