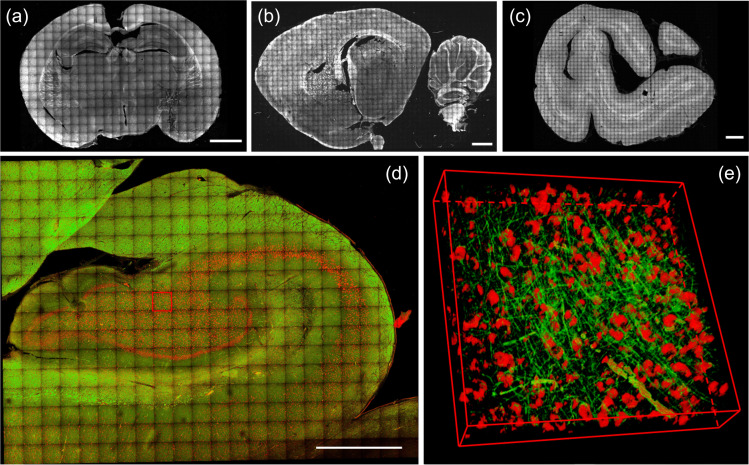
Fig. 5.
Reconstruction of brain sections treated with MAGIC: (a) mouse, (b) rat, (c) vervet monkey, (d) and human. Scale bar = 1 mm. (e) 3D rendering () of the stack indicated by the red box in d; green and red channels show the myelinated fibers enhanced by MAGIC and the autofluorescence of the cell bodies produced by lipofuscin pigments. Adapted from Costantini et al.11

