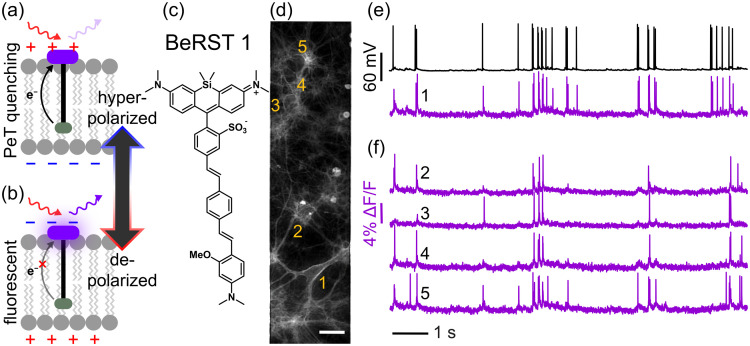
Fig. 9.
Voltage imaging with PeT sensors. (a)–(b) Mechanism of voltage sensing in PeT-based voltage-sensitive fluorophores. (c) Structure of a prototypical voltage-sensitive fluorophore, Berkeley Red Sensor of Transmembrane potential, BeRST 1. (d) Fluorescence image of cultured hippocampal neurons loaded with BeRST 1. Scale bar is . (e)–(f) Example traces from simultaneous electrophysiological (black) and optical recording (magenta) of spontaneous voltage fluctuations from neuron 1 (e) and spontaneous activity from neurons 2 to 5 (f); the corresponding neurons are labeled in (d). Adapted from Walker et al.178 and Liu and Miller,179 © 2020 American Chemical Society.

