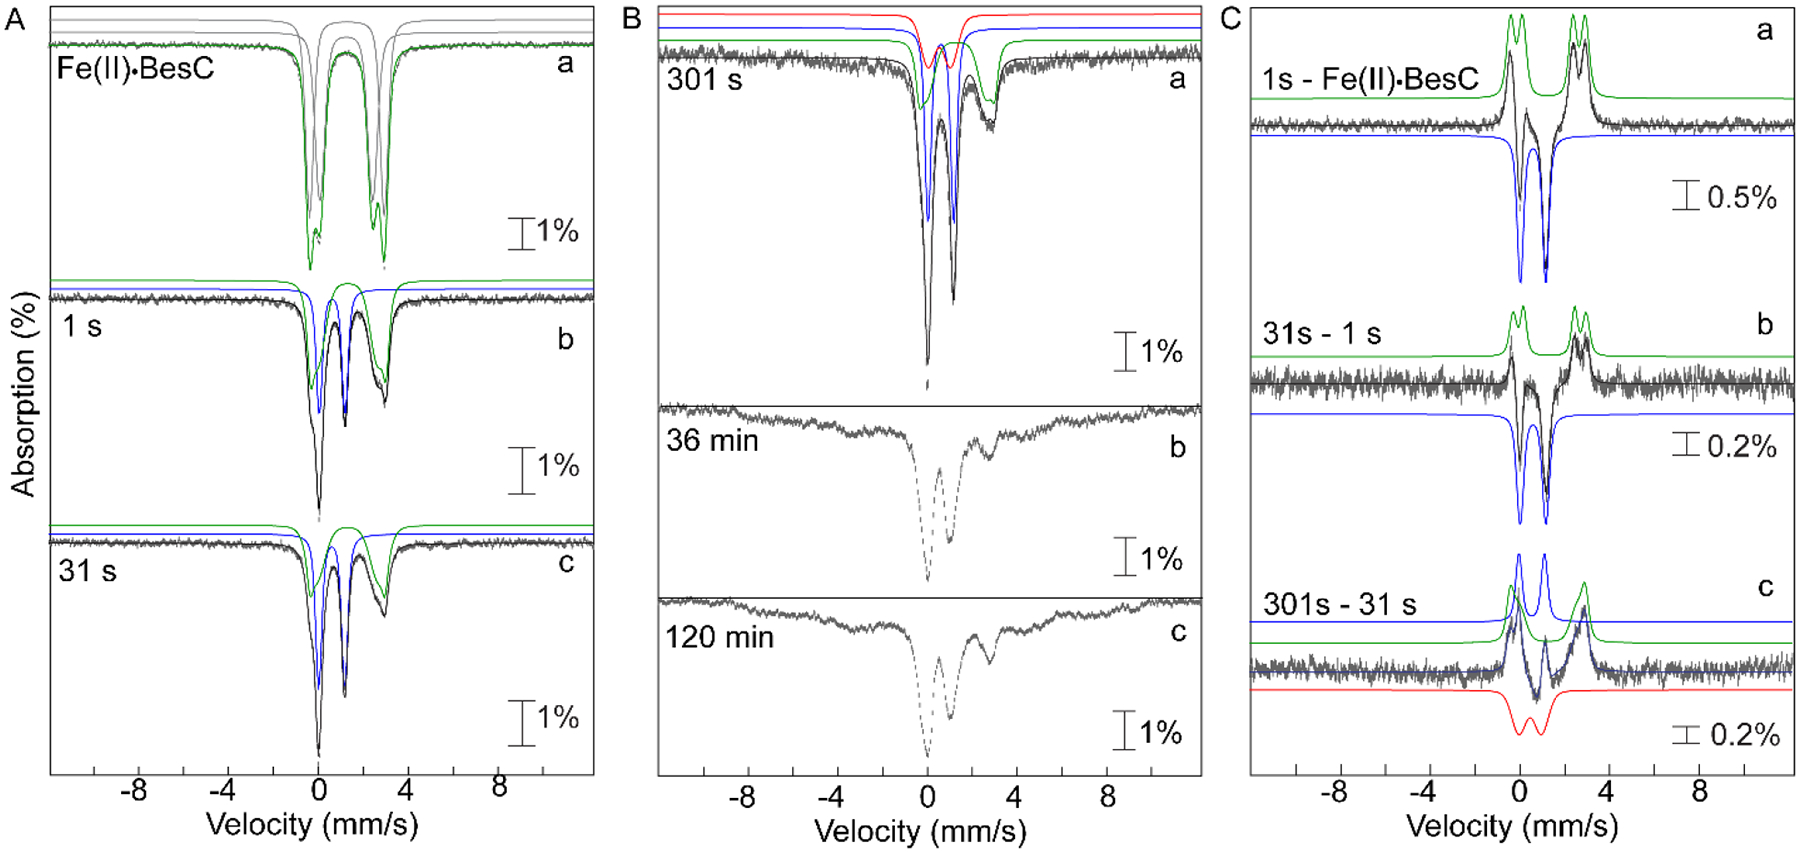
Figure 3.

4.2 K Mössbauer spectra, acquired with a 53 mT magnetic field applied parallel to the direction of propagation of the γ-beam, of freeze-quenched samples from the reaction of Fe(II)·BesC with O2. The experimental spectra are depicted by grey vertical bars of heights reflection the standard deviations of the absorption values during acquisition of the spectra. The black solid lines are the overall simulated spectra, and the colored lines are theoretical spectra illustrating the fractional contributions from the Fe(II)·BesC reactant complex (green), the μ-peroxodiiron(III) intermediate (blue), and the diiron(III) product (red), to the experimental spectra. Values of the parameters and relative areas of these spectra are provided in Table S3. (A) Spectra of samples freeze-quenched at short reaction times, during formation and decay of the μ-peroxodiiron(III) intermediate: (a) anoxic Fe(II)·BesC reactant complex; (b and c) spectra of samples quenched at 1 s and 31 s, respectively. (B) Spectra of samples frozen at longer reaction times: (a) 301 s, (b) 36 min, and (c) 120 min. These spectra demonstrate the disintegration of the diiron(III) “product” cluster and accumulation of uncoupled high-spin Fe(III) species at longer reaction times. (C) Difference spectra: (a) 1 s − Fe(II)·BesC reactant complex; (b) 31 s − 1 s; and (c) 301 s − 31 s. These spectra illustrate the changes associated with conversion of the Fe(II)·BesC reactant to the μ-peroxodiiron(III) intermediate and its subsequent conversion to diiron(III) product.
