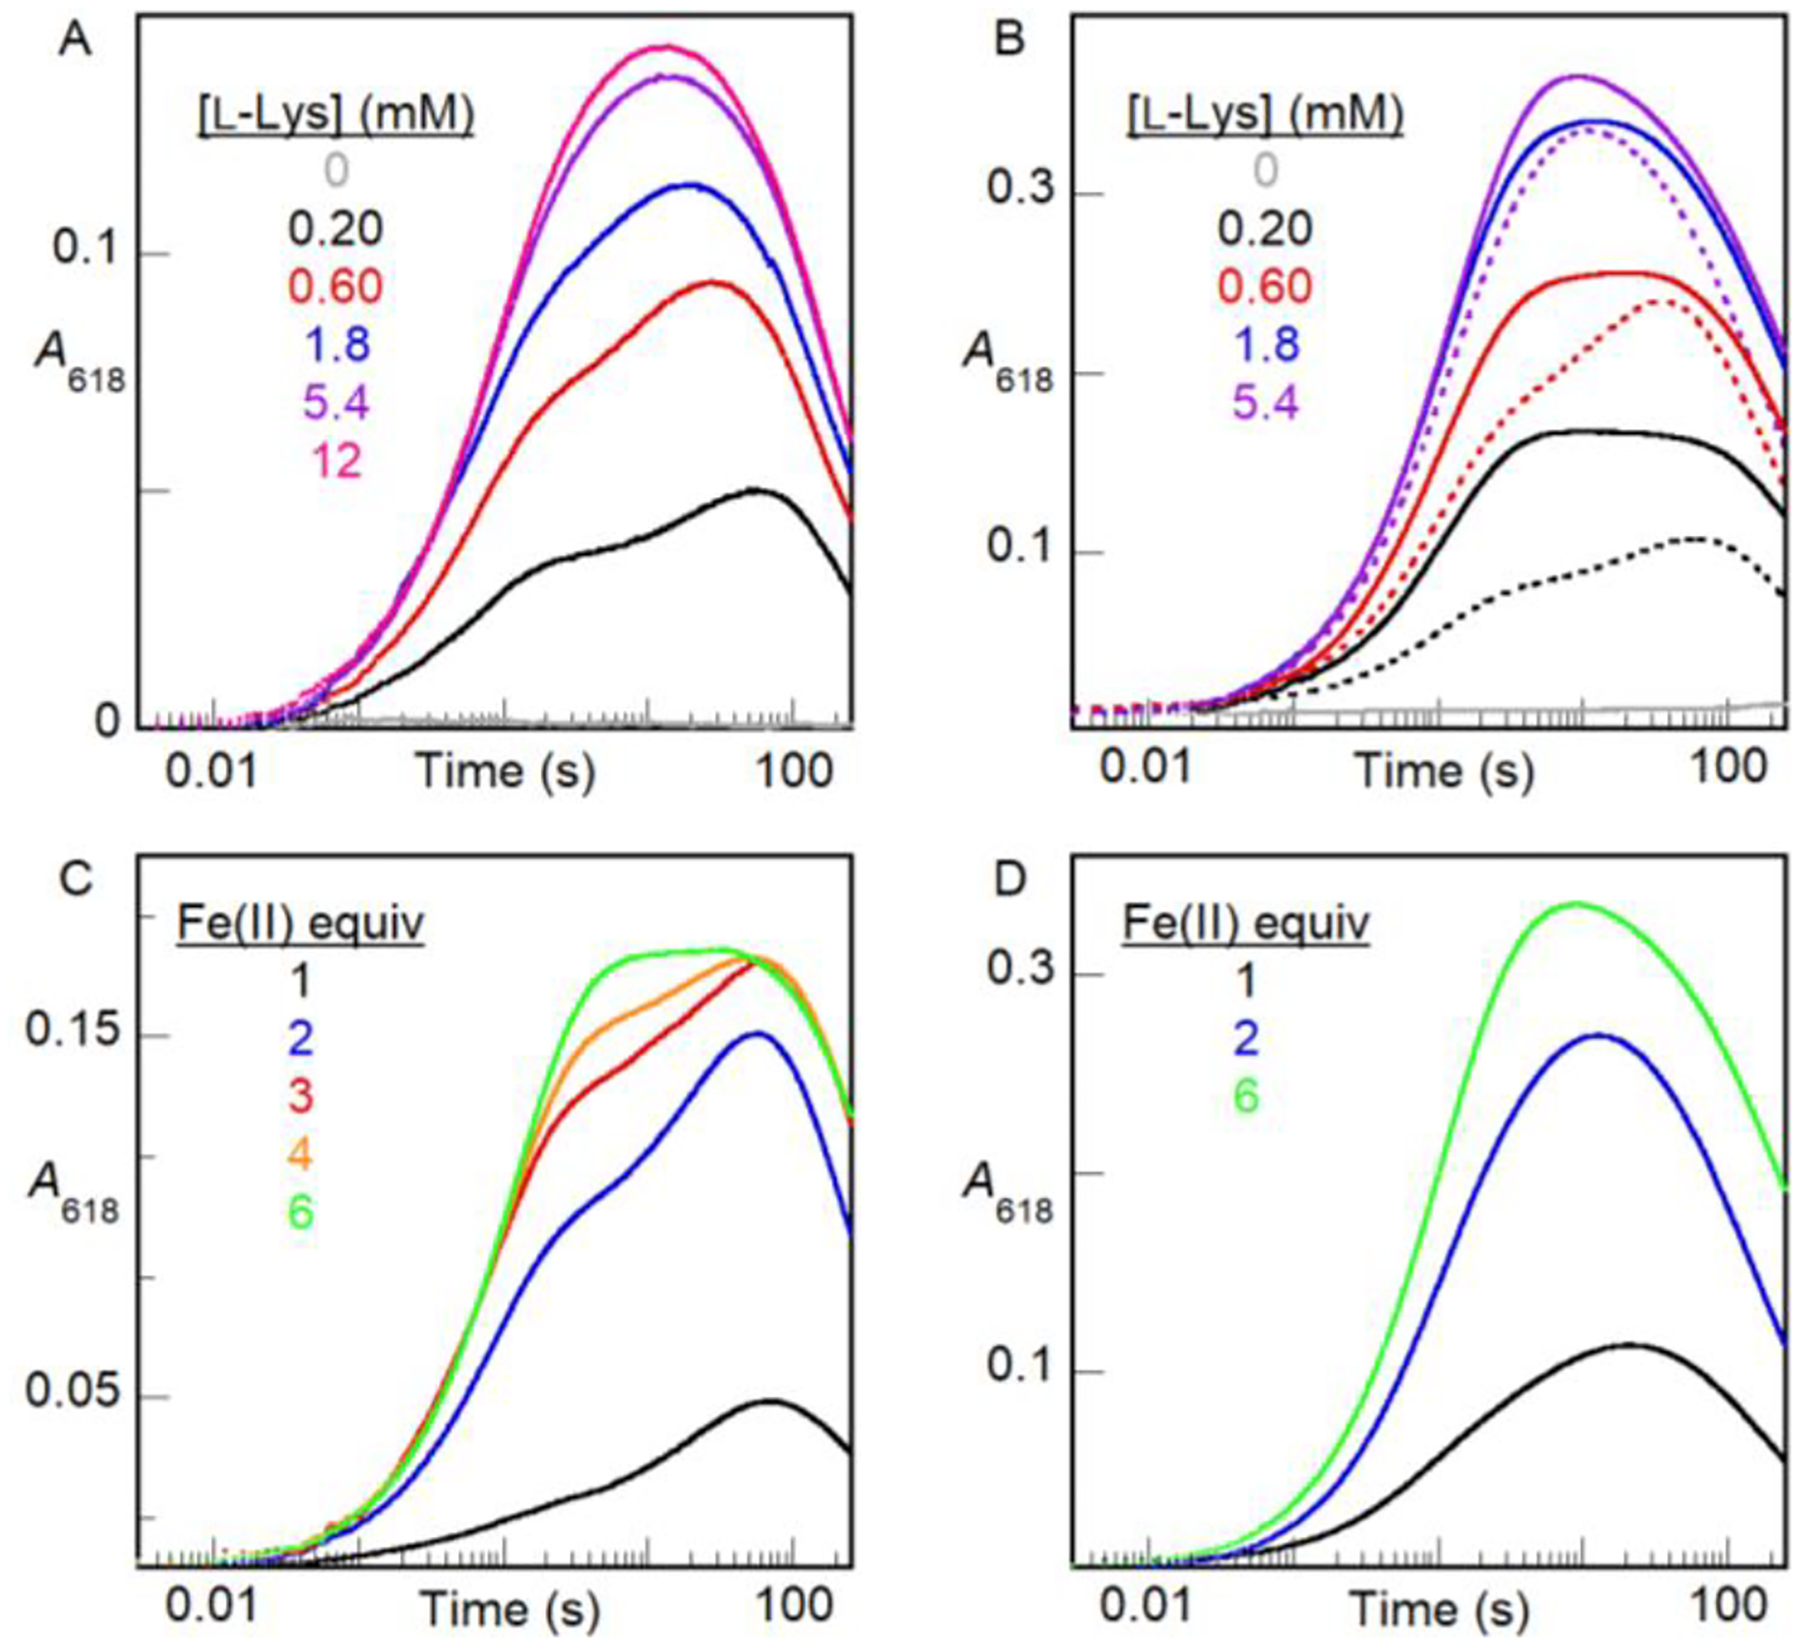
Figure 7.

A618-versus-time traces from stopped-flow absorption experiments in which an anoxic solution of BesC (0.20 mM), Fe(II) and L-Lys was mixed at 5 °C with an equal volume of O2-saturated buffer. In titrations of L-Lys, BesC was incubated with (A) 0.20 mM (1 molar equiv) or (B) 1.2 mM (6 molar equiv) of Fe(II). The dotted traces in panel B are from matching experiments (from Figure 6A) with 0.40 mM (2 molar equiv) Fe(II) and are overlaid to illustrate the impact of varying [Fe(II)]. In titrations of Fe(II) (0.20–1.2 mM), BesC was incubated with (C) 0.20 mM (1 molar equiv) or (D) 5.4 mM (27 molar equiv) of L-Lys.
