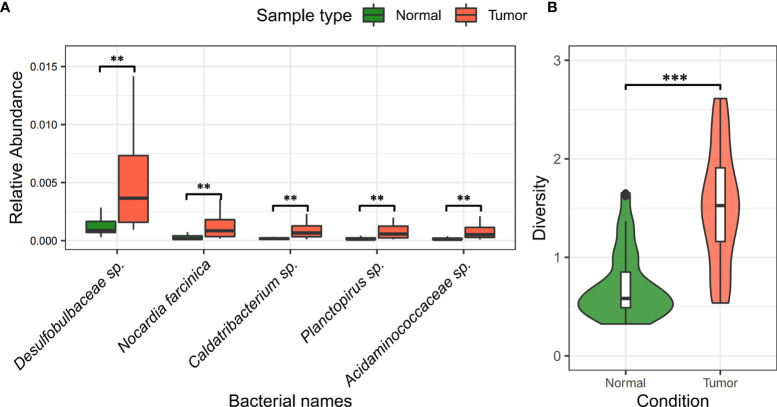
Figure 5.
Difference and diversity of bacteria in liver cancer samples. (A) Differentiation of bacteria between liver tumor tissue and normal tissue. “**” indicates FDR < 0.05; “***” indicates FDR < 0.001. (B) Analysis of alpha diversity of bacteria in tumor and normal tissues. The green color on the left indicates normal samples, the red part on the right indicates tumor samples, and the middle BASE part indicates the interquartile range.

