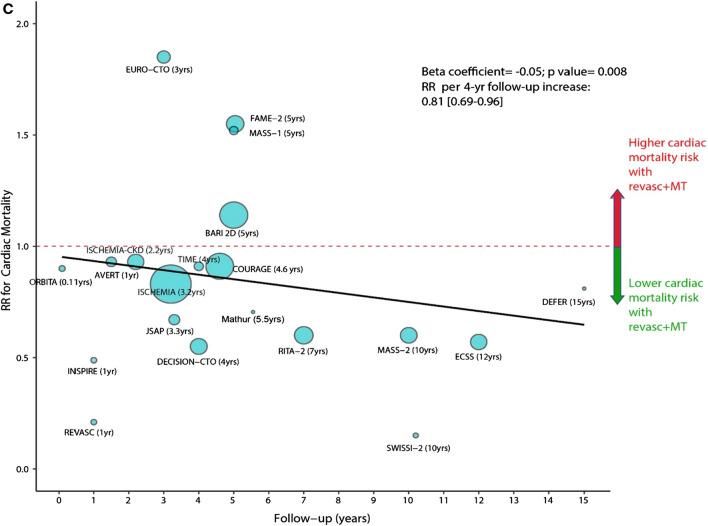
Fig. 2.
Figure demonstrating meta-regression of rate ratios for cardiac mortality with revascularisation plus medical therapy vs. medical therapy alone in relation to follow-up duration. The size of the data markers is proportional to the size of trial. Rate ratios lower than 1 indicate cardiac death reduction with revascularisation. The solid line represents the meta-regression slope of the change in cardiac death rate ratio for revascularisation plus medical therapy vs. medical therapy alone with increasing length of follow-up. Reproduced with permission from the European Heart Journal (Naverese et al. [19])

