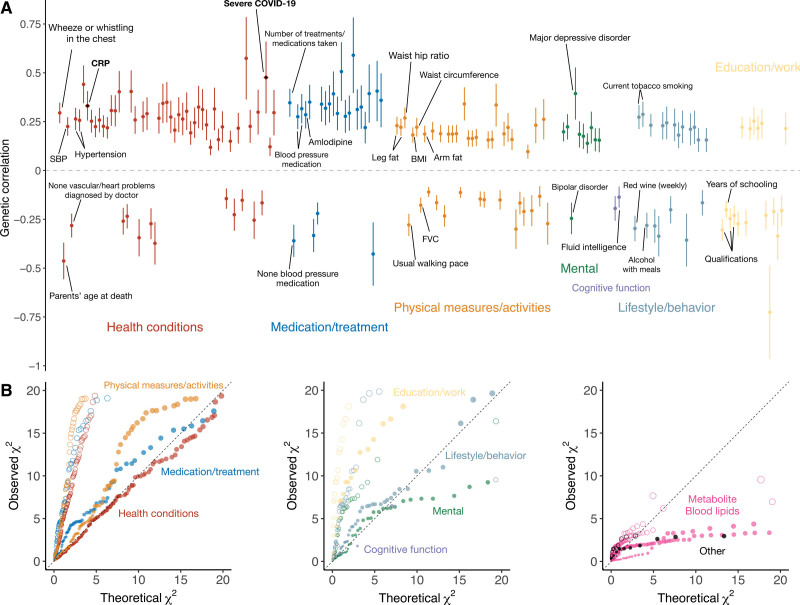
Figure 2.
Genetic correlations between plasma ACE2 and human complex traits and diseases. A, Statistically significant (false discovery rate <5%) genetic correlations with ACE2 (angiotensin-converting enzyme 2) are shown; severe COVID-19, C-reactive protein (CRP), and other representative traits are labeled. Error bars represent SEs. Colors label different groups of phenotypes. Detailed explanations of the annotated phenotypes are given in the Supplemental Material. B, Enrichment of genetic correlations with ACE2 within each group of phenotypes. Circles are the quantile-quantile (QQ) plots of the genetic correlations test statistics against the null, whereas the solid dots are the QQ plots of the test statistics within each phenotype group against all the analyzed phenotypes. BMI indicates body mass index; FVC, forced vital capacity; and SBP, systolic blood pressure.

