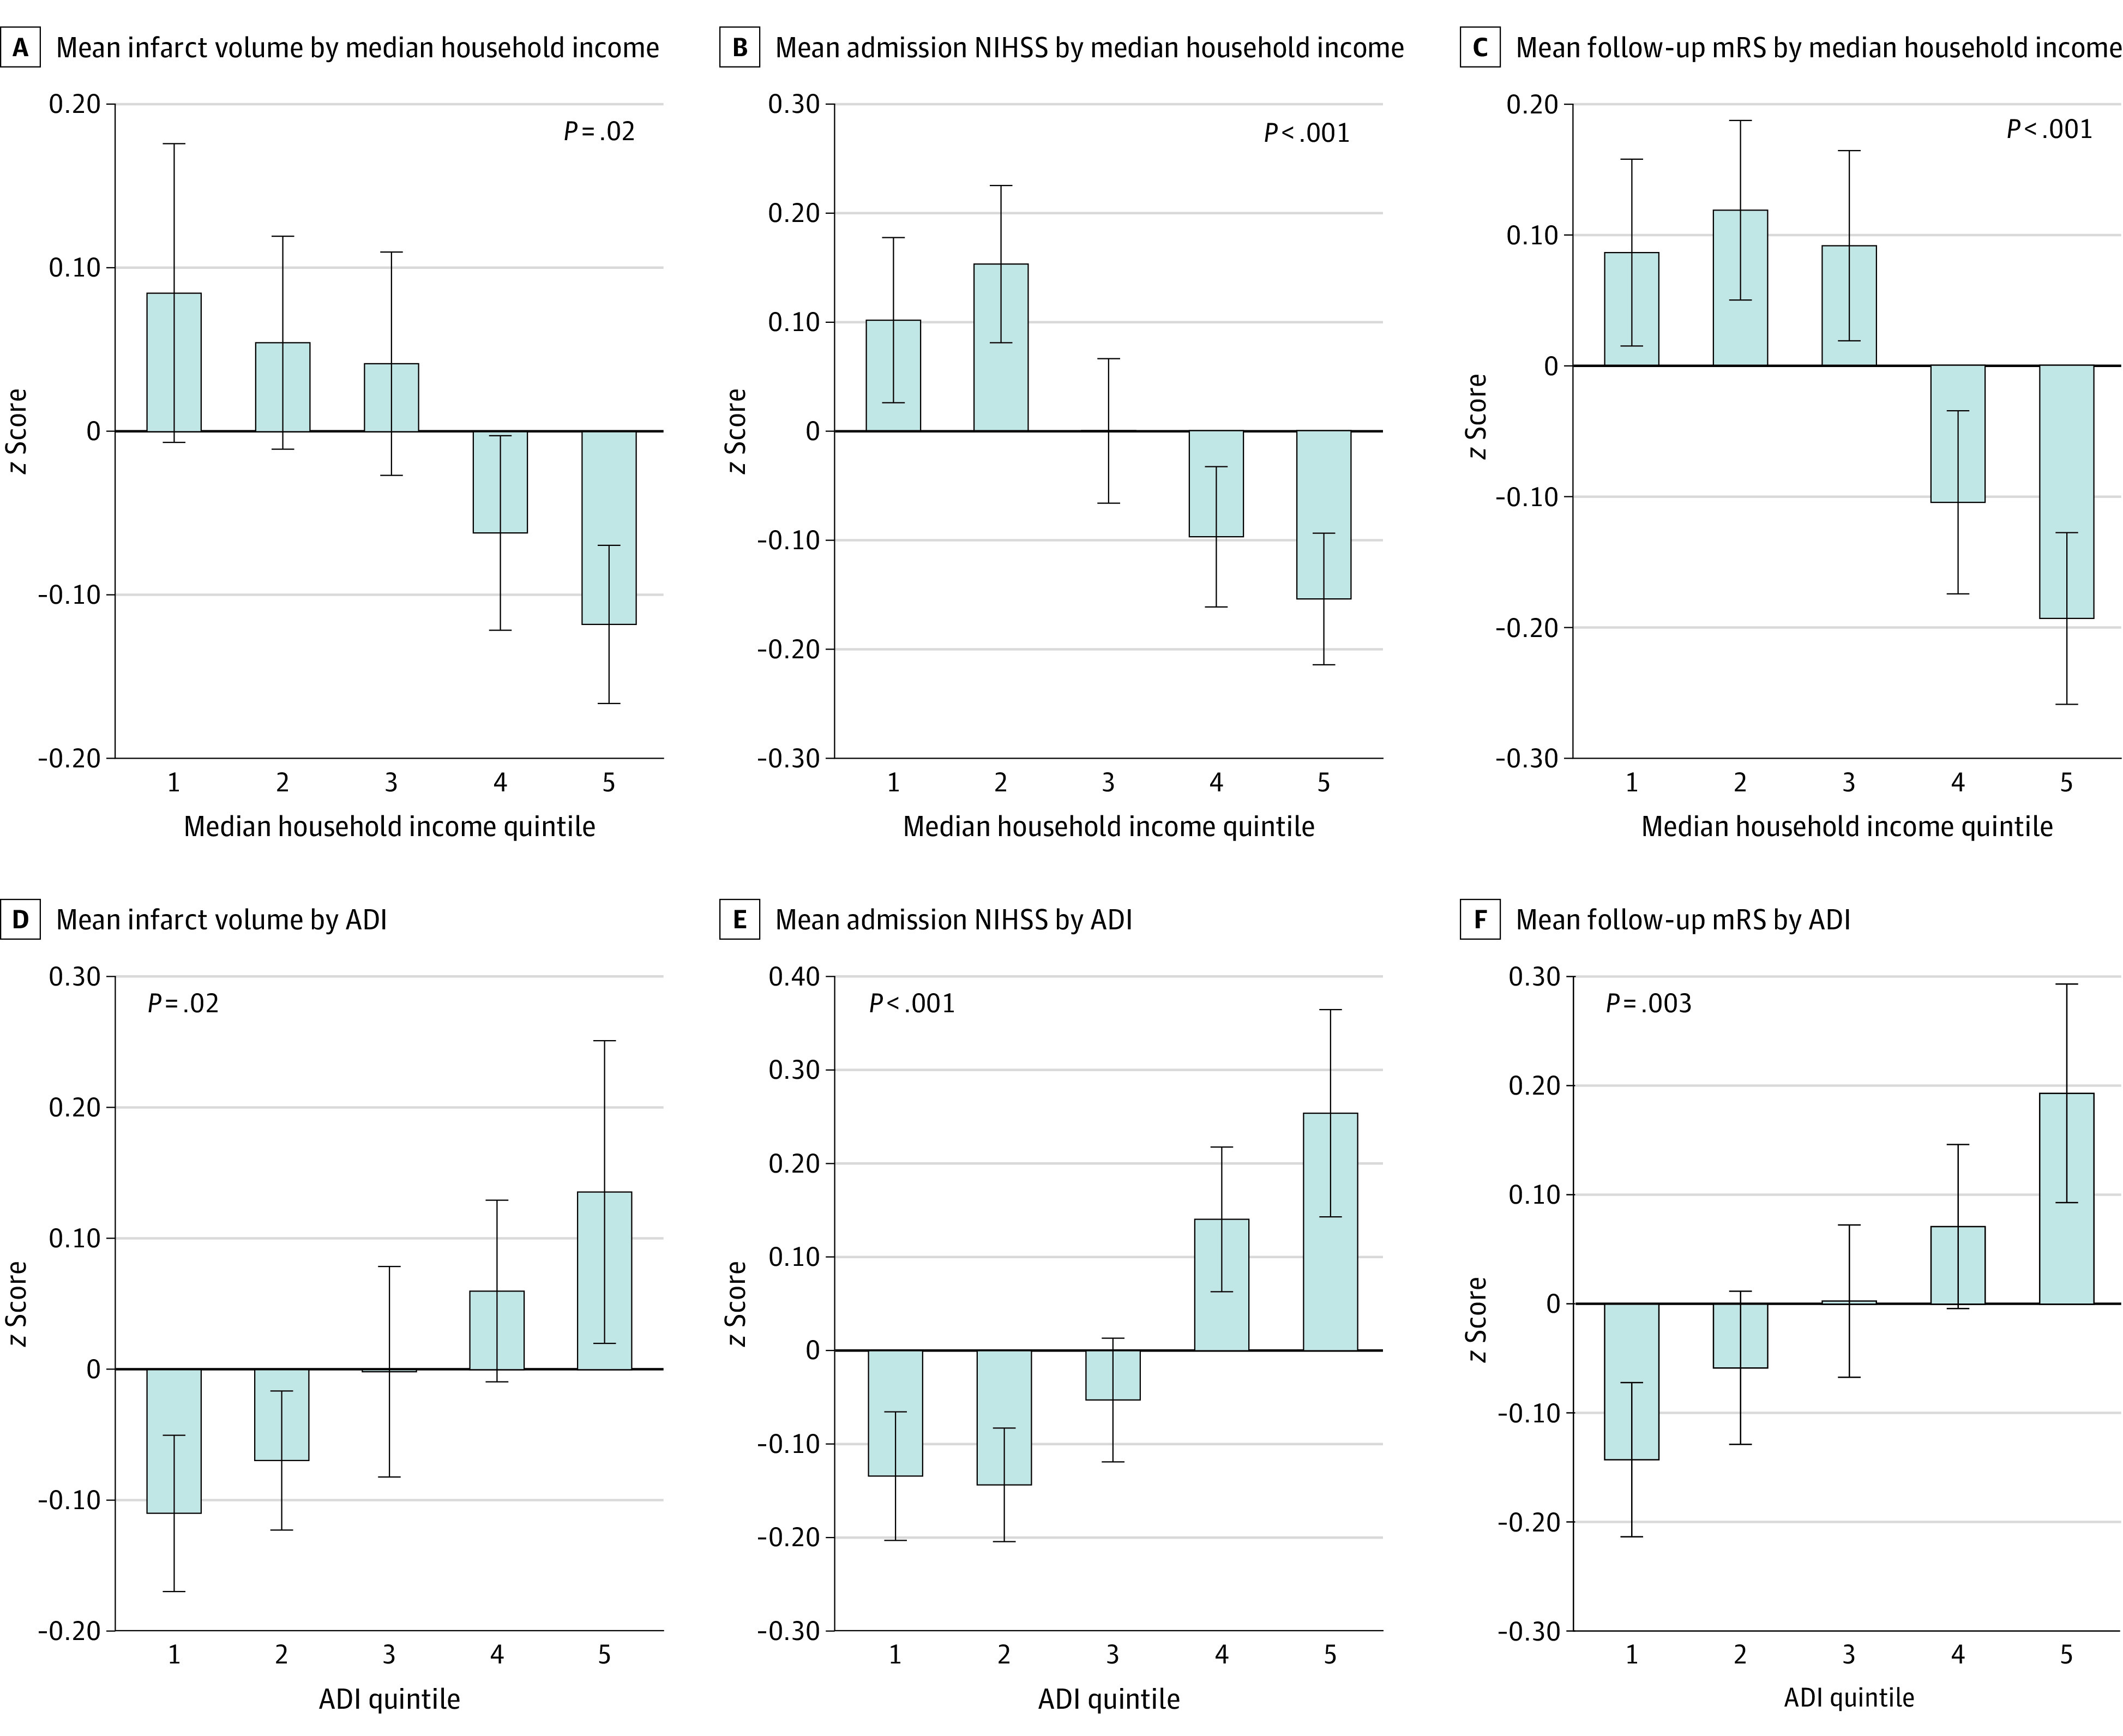
Figure 2. Socieconomic Status Measures vs Study End Points.

Measures of SES included income (A-C) and area deprivation index (ADI) (D-F) in quintiles. Infarct size was measured using volume on magnetic resonance imaging; clinical stroke severity on admission, using the National Institutes of Health Stroke Scale (NIHSS); and 90-day functional outcome, using the modified Rankin Scale (mRS). Error bars indicate 1 SD.
