Figure 2.
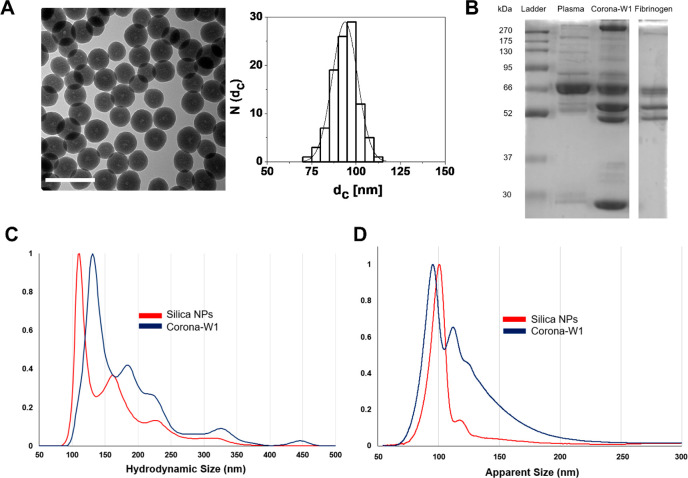
Characterization of the silica NP and its biomolecular corona (1 wash, W1) at the plasma/NP ratio of 1.98. (A) TEM images of silica NPs and their corresponding size distribution histograms, plotted as number of NPs N(dc) that have a core diameter of dc = 93.7 ± 7.1 nm. The scale bars correspond to 200 nm. (B) The protein pattern of the corona in comparison with full plasma and fibrinogen. (C) NTA hydrodynamic size distributions of pristine silica NPs and silica corona. The data are shown as the average of three measurements. The peaks were normalized against the tallest peaks (highest particle concentration) that had a value of 1. (D) DCS size distributions of pristine silica NPs and silica corona. The data were shown as relative weight particle size distribution. The tallest peak (highest weight value) had a value of 1, and all other particle size peaks were then normalized against this base peak to give a relative weight distribution.

