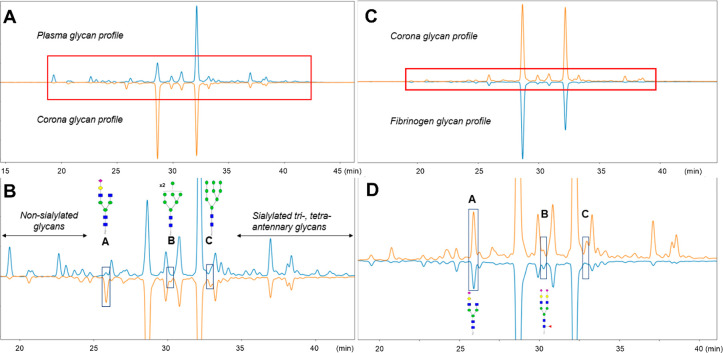
Figure 4.
Comparison of the silica corona glycan profile with full plasma (A,B) and fibrinogen (C,D). (A) Chromatograms of released glycans from plasma (up, blue) and the silica corona (down, orange) were normalized to the highest peak intensity (GPcorona31 in the corona’s chromatogram). (B) Zoomed-in section of the box highlighted in part A. Three areas enclosed by boxes show noticeable differences between the two glycan profiles, containing A2G1S1 (A), coeluted M8 and FA2G2S2 (B), and M9 (C). (C) Chromatograms of released glycans from the silica corona (up, orange) and fibrinogen (down, blue) were normalized to the highest peak intensity (GPcorona22). (D) Zoomed-in section of the box is highlighted in part C. Boxes A and B contain two shared glycans between the corona sample and fibrinogen control.

