Figure 5.
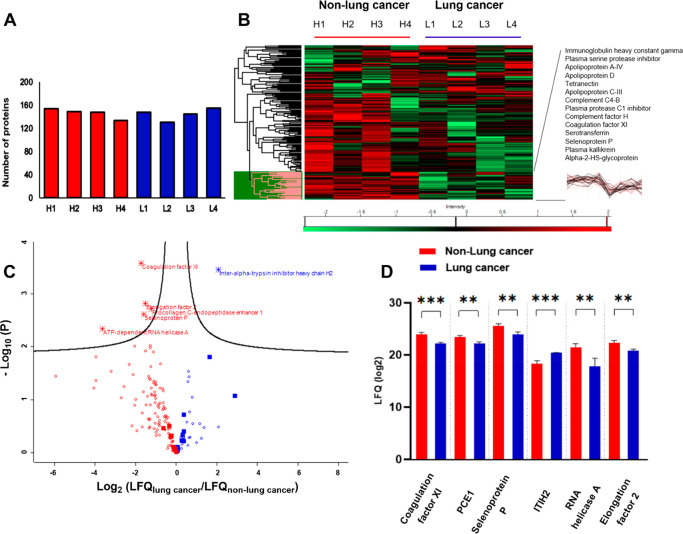
Comparison between the lung cancer (L1, L2, L3, L4) and non-lung cancer samples (H1, H2, H3, H4) by LFQ-MS. (A) Numbers of proteins that met the LFQ normalization criteria (default in Maxquant). (B) Protein heatmap of the samples after z-scoring. A protein cluster was expanded with some protein of interest and their intensity profiles (black). (C) Volcano plot with fold-change and p-values shows the t test result between the two groups. Red: proteins more abundant in the non-lung cancer group. Blue: proteins more abundant in the lung cancer group. Star: 6 proteins with significant difference. Filled square: proteins in the top 20 abundances. (D) LFQ intensity of the proteins with significant differences. Error bars: SD of the mean. P values <0.01**; <0.001***.

