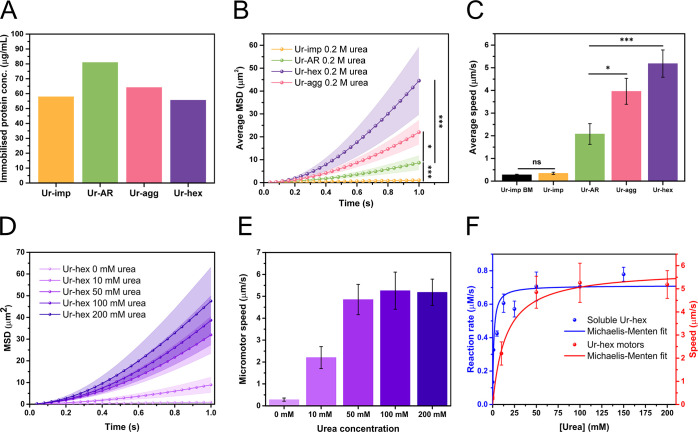
Figure 3.
Motion characterization of urease micromotors. (A) Measured protein content immobilized onto HSMCs for Ur-AR (green bar), Ur-hex (purple bar), Ur-agg (pink bar), and Ur-imp (orange bar) motors. (B) Average mean-squared displacement (MSD) of the Ur-AR (green), Ur-hex (purple), Ur-agg (pink), and Ur-imp (orange) motors with 0.2 M urea. (C) Average speed of the Ur-AR (green bar), Ur-hex (violet bar), Ur-agg (pink bar), and Ur-imp (orange bar) with 0.2 M urea and the Brownian motion (BM) (speed in the absence of fuel) of Ur-imp motors (black bar). The p values determined from pairwise t tests are represented in panels B and C in the New England Journal of Medicine (NEJM) format: ***: p value ≤ 0.001; **: p value ≤ 0.01; *: p value ≤ 0.05; ns: nonsignificant. (D) Average MSD of the Ur-hex motors at 0, 10, 50, 100, and 200 mM urea (light to dark purple). (E) Average speed of the Ur-hex motors at 0, 10, 50, 100, and 200 mM urea (light to dark purple). (F) Michaelis–Menten fit of the data for the activity assays for soluble Ur-hex (blue line and spheres, left y-axis, same data as shown in Figure 1E) compared to the Michaelis–Menten fit of the Ur-hex motor self-propulsion speeds at different concentrations of urea (red line and spheres, right y-axis, same data as shown in panel B).

