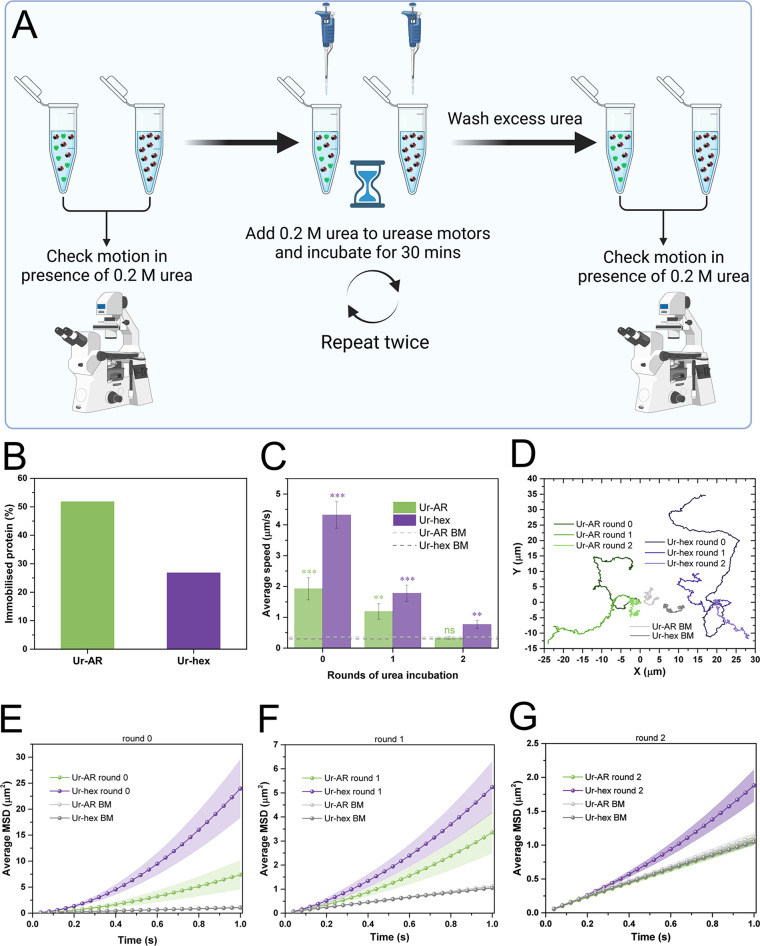
Figure 6.
Reusability of urease motors. (A) Schematic diagram of reusability experiment. An aliquot of both motors was used to visualize the self-propulsion in the presence of 0.2 M urea. Then, 0.2 M urea is added to both motors and left to react for 30 min. Particles were washed from excess urea by centrifugation, and loss of motility was evaluated by taking an aliquot of the washed stock. This cycle was repeated twice. (B) Quantity of immobilized protein on the urease motors, expressed as a percentage of the initial quantity used to functionalized the particles (both approximately 200 μg/mL). (C) Average speeds for both types of urease motors before (0) and after the first and second incubation with urea. The p values from the pairwise t tests comparing the motion at 0.2 M urea with the no-fuel control (represented by green and purple dashed lines, for Ur-AR and Ur-hex, respectively) are represented as stars above the bars (same NEJM format as in previous figures). (D) Representative trajectories for the Ur-AR (shades of green) and Ur-hex (shades of purple) motors at 0.2 M urea and after 0, 1, and 2 rounds of incubation. The Brownian motion of the Ur-AR and Ur-hex motors is represented in two shades of gray. (E–G) Average MSDs of the Ur-AR (green) and Ur-hex (purple) motors before (E) and after first (F) and second (G) rounds of incubation with 0.2 M urea. The MSDs from the Brownian motion of Ur-AR and Ur-hex motors are also represented in all plots in shades of gray.

