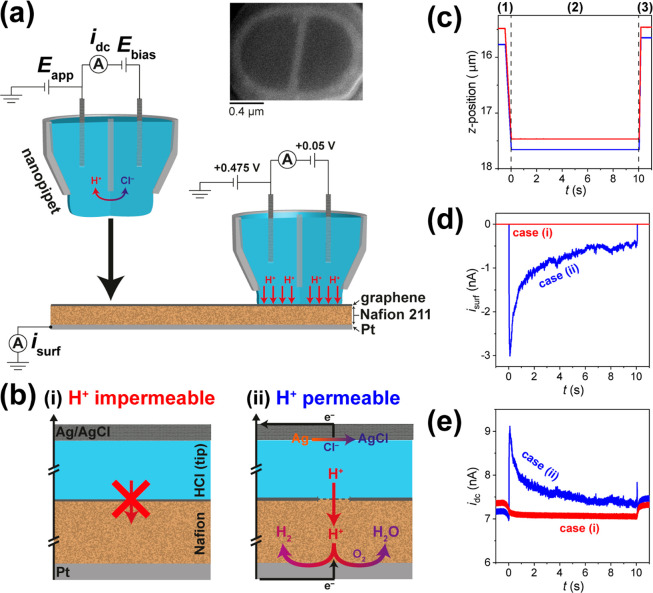
Figure 1.
(a) Schematic of the SECCM set up employed herein. The dual-channel micropipet probe (representative SEM image shown, inset) is filled with electrolyte solution (e.g., 0.1 M HCl) and equipped with identical Ag/AgCl QRCEs. During operation, Ebias is applied between the QRCEs, and the resulting idc is used as a feedback signal to detect meniscus–surface contact. A potential of Eapp was applied to one of the QRCEs to control the Pt WE potential (Esurf), where Esurf = −(Eapp + Ebias/2), and the WE surface current (isurf) was measured. (b) Schemes showing meniscus–surface contact with (i) proton-impermeable (red) and (ii) proton-permeable (blue) regions of the CVD graphene|Nafion membrane, along with representative plots of (c) z-position, (d) isurf, and (e) idc. In case (i), ion flow between the WE and QRCEs is blocked by the impermeable graphene layer; no electrochemistry can occur at the Pt WE; isurf is zero; idc only responds to making/breaking meniscus–surface contact. In case (ii), there is ion flow at proton-permeable sites of the graphene layer; proton-consuming reactions (HER and/or ORR) occur at the Pt WE; isurf is nonzero; idc responds to making/breaking meniscus–surface contact and also reflects isurf flowing at the WE (i.e., the counter electrode current). The plots in (c–e) were obtained with Ebias = 0.05 V, Eapp = 0.475 V, and Esurf = −0.5 V and are divided into three distinct stages, indicated by dashed lines in (c): (1) approach (i.e., t < 0 s), (2) application of electrochemical waveform (i.e., 0 ≤ t ≤ 10 s), and (3) retract (i.e., t > 10 s). Note that protons are denoted as H+ in this figure.

