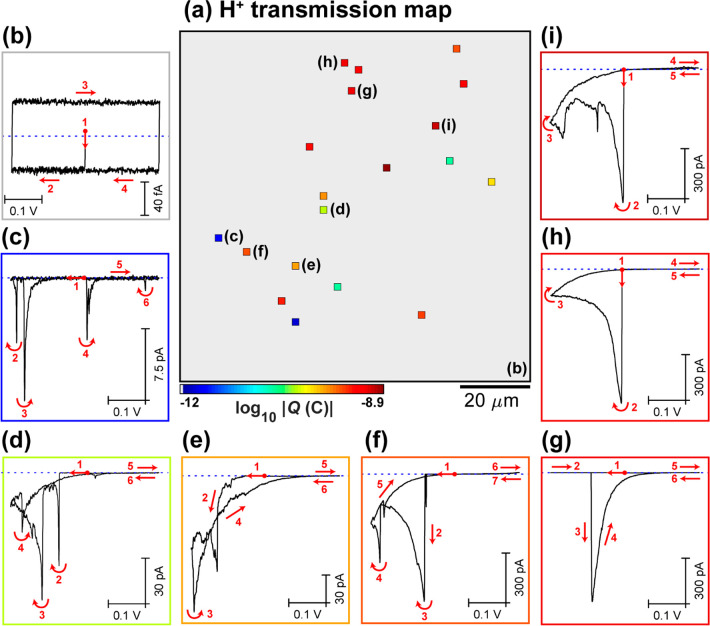
Figure 2.
(a) Static image of electrochemical activity (proton transmission), collected over a 100 × 100 μm2 area of the graphene|Nafion membrane, using SECCM in the voltammetric (υ = 0.1 V s–1, 1 cycle) hopping mode configuration (hopping distance = 2 μm, 51 × 51 pixels, tip area ≈1 μm2). This image was obtained by integrating (with respect to time) the spatially resolved |isurf| data from SI Movie S1, over the entire Esurf range (−0.225 to 0.175 V vs Ag/AgClQRCE). (b–i) Spatially resolved CVs (isurf–E curves), obtained by (b) averaging all inactive pixels (N = 2582) or (c–i) from the individual (representative) active pixels, indicated in (a). The border of each CV in (b–i) corresponds to the corresponding pixel colors in (a). Note that in (a), pixels with log10|Q| values less than 3× the electrical noise level are assigned a gray color and are considered to be inactive.

